
Does Extreme Temperature Change the Total?
Rain, snow and wind already got the full treatment: they knock points off a game without changing who wins (that's this post). Temperature had to wait, because we didn't have real game-time temperatures for 2005–2025 yet. Now we do: 16,850 games with a real kickoff reading, not counting games under a roof. Our hunch going in was about extremes: that freezing cold and brutal heat would both mess teams up. The data had other plans.
Heads up
These numbers were updated after we fixed a weather-timing bug that affected every reading on the site, temperature included (story in this post). Every finding here held up, and a few got clearer.
A real effect, and it's a straight line
Even after accounting for how good the two teams are, warmer kickoffs go with more total points. It's not a huge swing, but it's a dependable one, not a fluke from a few weird games. Our original idea was that both ends would hurt scoring, so the next question was whether the pattern bends into a U. It doesn't. The hottest games don't curve back down the way "the heat wears offenses out" would predict. It's just: warmer, more points.
Wait, aren't cold games just late-season games?
Good catch, if you were thinking it. Cold games are mostly in November and bowl season, and hot ones are mostly in late August and September. So maybe "temperature" is secretly "time of year" (tougher defenses late, sloppier offenses early). We checked. When we account for the time of season, the temperature effect doesn't shrink. It gets stronger, more than doubling. This isn't late-season defense wearing a weather costume.
The hottest and coldest kickoffs on record
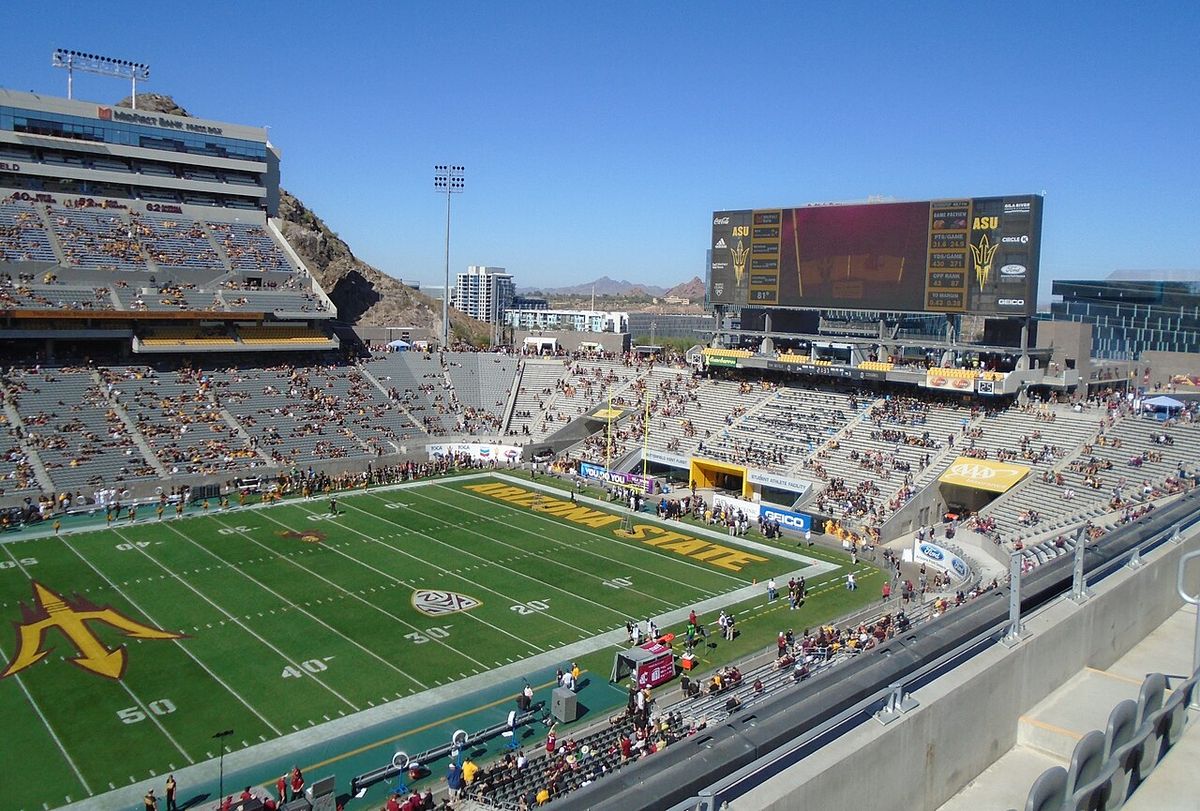

Games under a roof don't count, since the outdoor temperature never reached the field.
| Date | Matchup | Score | Temp |
|---|---|---|---|
| Sep 10, 2023 | Oklahoma State @ Arizona State | 27–15 | 104.1°F |
| Sep 6, 2013 | Sacramento State @ Arizona State | 0–55 | 103.1°F |
| Sep 2, 2011 | UC Davis @ Arizona State | 14–48 | 103.0°F |
| Sep 2, 2017 | Cal Poly @ San José State | 13–34 | 101.5°F |
| Oct 6, 2024 | Kansas @ Arizona State | 31–35 | 101.3°F |
| Date | Matchup | Score | Temp |
|---|---|---|---|
| Nov 24, 2013 | Kansas @ Iowa State | 0–34 | 3.8°F |
| Nov 23, 2019 | Colorado State @ Wyoming | 7–17 | 8.0°F |
| Nov 16, 2014 | San Diego State @ Boise State | 29–38 | 9.9°F |
| Nov 22, 2013 | UNLV @ Air Force | 41–21 | 11.9°F |
| Dec 23, 2022 | Baylor @ Air Force | 15–30 | 12.4°F |
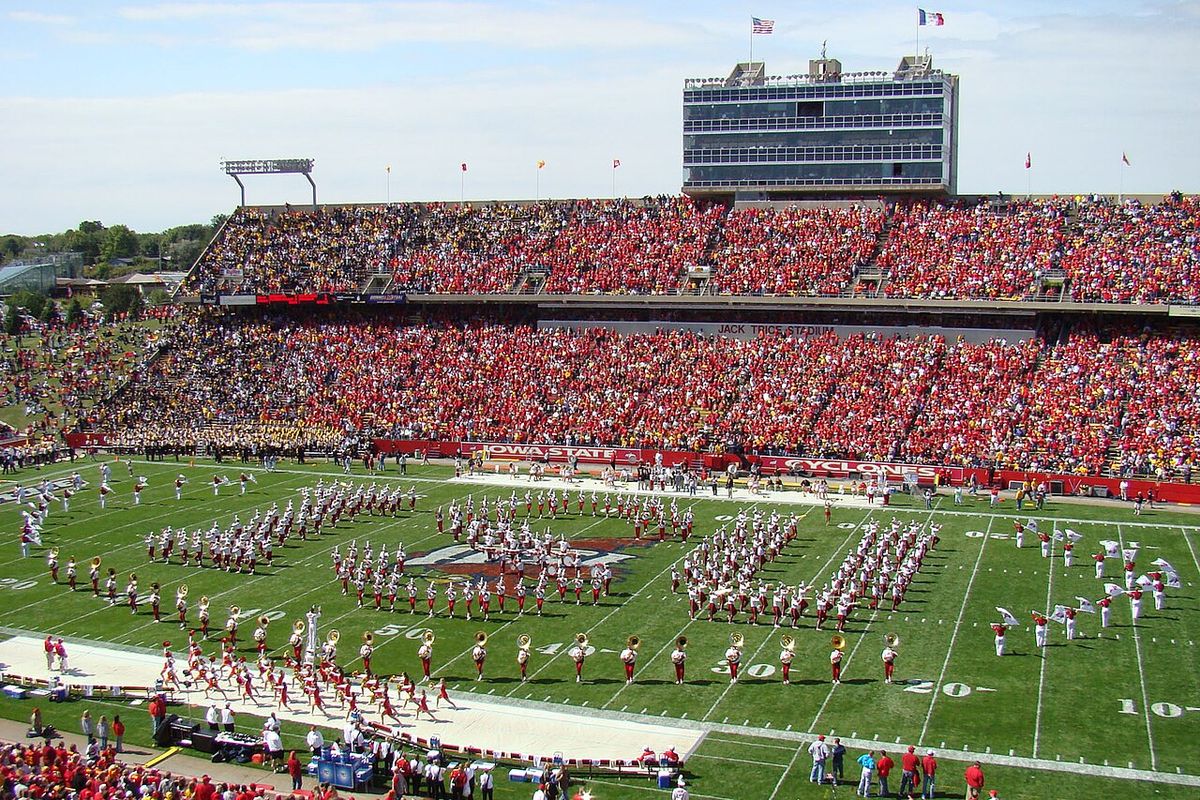

San Diego State's 2014 trip to Boise is on this list for a reason worth remembering: a warm-weather team, far from home, in seriously brutal cold. That's a different question from "was it cold?", and we tested it directly in another post.
Do the sportsbooks already know about this?
Sportsbooks post a predicted total for every game (the over/under). If games keep landing above or below that number as the temperature changes, the sportsbooks aren't fully accounting for temperature. Across 7,200 games with a real posted number and a real temperature (2017–2025), the answer is… maybe? It's right on the edge of what we'd call a real pattern. The details are messy: freezing games actually landed under the line on average (by −0.89 points), while the four warmer groups all landed between +0.3 and +0.5 over. With only nine seasons of real lines, we're calling this one unresolved.
Does it help the prediction model?
Being real in old games doesn't automatically earn temperature a spot in the model that predicts this week's games. We gave it the same fair test every other idea got (see how the model was built): train only on earlier seasons, grade on later ones, and only use what was known before kickoff. Added to what the model already knows (team strength, weather and home field), temperature barely moves the needle:
See the full top 50 hottest or coldest kickoffs on the Rankings page. Next: does temperature change more than the score? Does it change how teams actually play?