
Does It Matter How Far From Home the Weather Is?
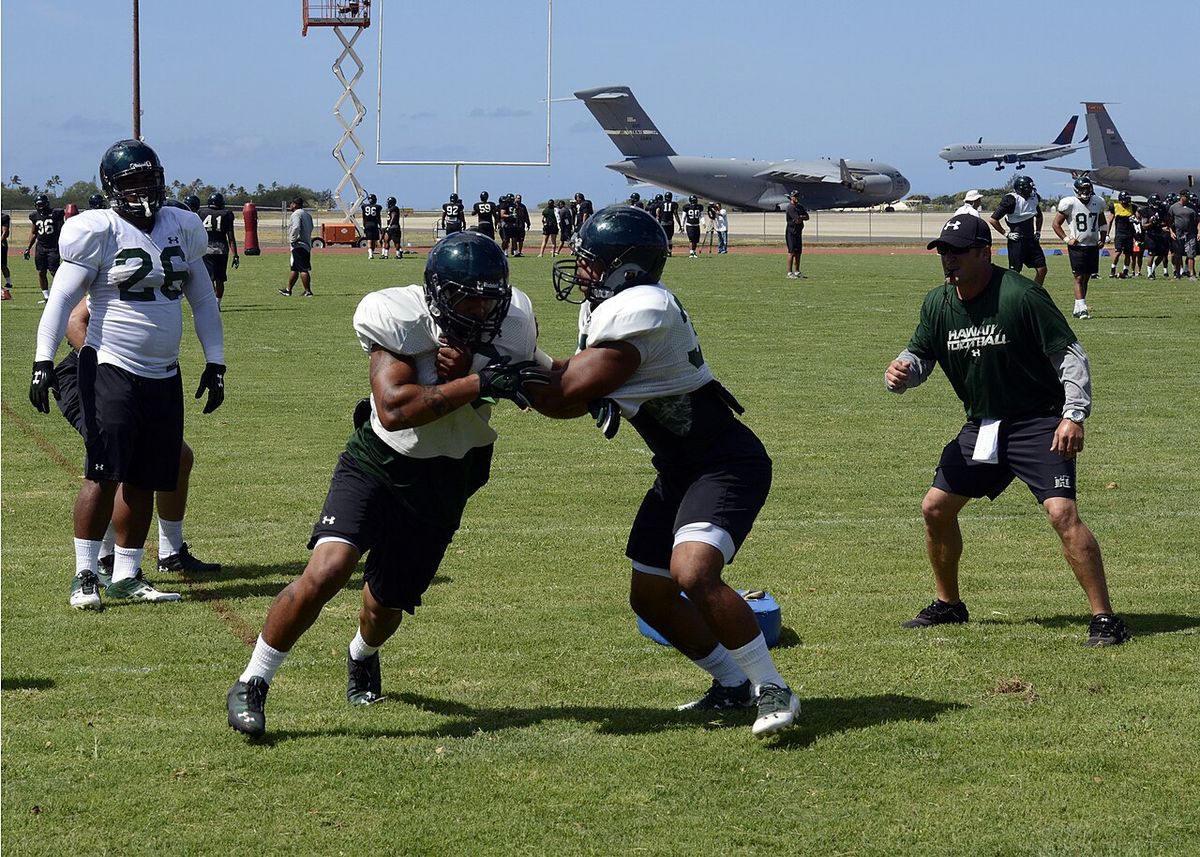
In 2013, Hawai'i flew to Laramie, Wyoming and played in 26.3°F weather. Think about that. A team that lives at sea level in the tropics, where "cold" means you might need a hoodie, got dropped into one of the chilliest stadiums in the sport. This post isn't asking "was it cold?" It's asking "was it cold for them?" A Wyoming team and a Hawai'i team felt the exact same temperature that day. They probably didn't feel the same about it.
Heads up
These numbers were updated after we fixed a weather-timing bug that affected the whole site (story in this post). Every conclusion here held up.

Step one: what's "normal" for each team?
Every team gets its own normal kickoff temperature for home games, month by month, because a team's September normal isn't its November normal. Teams with domes count too: we use the real outdoor temperature in their home city, since that's the climate they actually live and practice in, whatever happens under the roof on game day. Team-months with fewer than 3 home games get tossed as too thin to trust, which leaves 659 team-month normals. Then the "temp shock" is how far a road game's temperature was from the visiting team's own normal. (The home team is always close to its own normal, by definition, so this is really about the visitors.)
The trail of fake clues
Our first look seemed almost too good. Whether a road game was warmer or colder than the visitors were used to, and by how much, seemed to explain all four stats we tested (passing yards, rushing yards, turnovers and final margin), even after accounting for the actual temperature and how good both teams were. Here's what happened when we poked at it.
Fake clue #1: it was really just who the team is
A team's "normal" temperature is basically a fixed fact about it (its home city's climate), so it might just be standing in for the team itself. Cold-weather programs tend to run the ball a lot, no matter the weather that day; warm-weather programs tend to throw more. Once we accounted for each team's own long-term style, the passing and margin effects collapsed to basically nothing.
Fake clue #2: it was really just the time of year
Rushing yards and turnovers survived clue #1. But the month of a road trip decides which monthly normal we compare against, which could sneak "time of season" back in through the side door (the same trap temperature had to dodge in the first temperature post). Once we accounted for time of season too, those two collapsed as well.
What survived: how big the surprise was, not which way
The original question was about a big surprise, not its direction. A team thrown 30°F off its normal is arguably in the same boat whether it's way hotter or way colder. So we tested the size of the gap, ignoring direction, with every check from both fake clues still in place. Turnovers and margin both came back real. Small, but real.
How small is "small"?
Pretty subtle in raw form. That's exactly why it only showed up after both fake clues were ruled out, instead of jumping out of a simple average:
The biggest temperature shocks on record
| Date | Matchup | Score | Shock | Actual temp |
|---|---|---|---|---|
| Oct 10, 2009 | TCU @ Air Force | 20–17 | 55.9°F | 20.5°F |
| Nov 16, 2014 | San Diego State @ Boise State | 29–38 | 51.8°F | 9.9°F |
| Nov 23, 2013 | Hawai'i @ Wyoming | 56–59 | 51.2°F | 26.3°F |
| Nov 22, 2013 | UNLV @ Air Force | 41–21 | 50.8°F | 11.9°F |
| Dec 7, 2013 | UCF @ SMU | 17–13 | 47.5°F | 25.4°F |
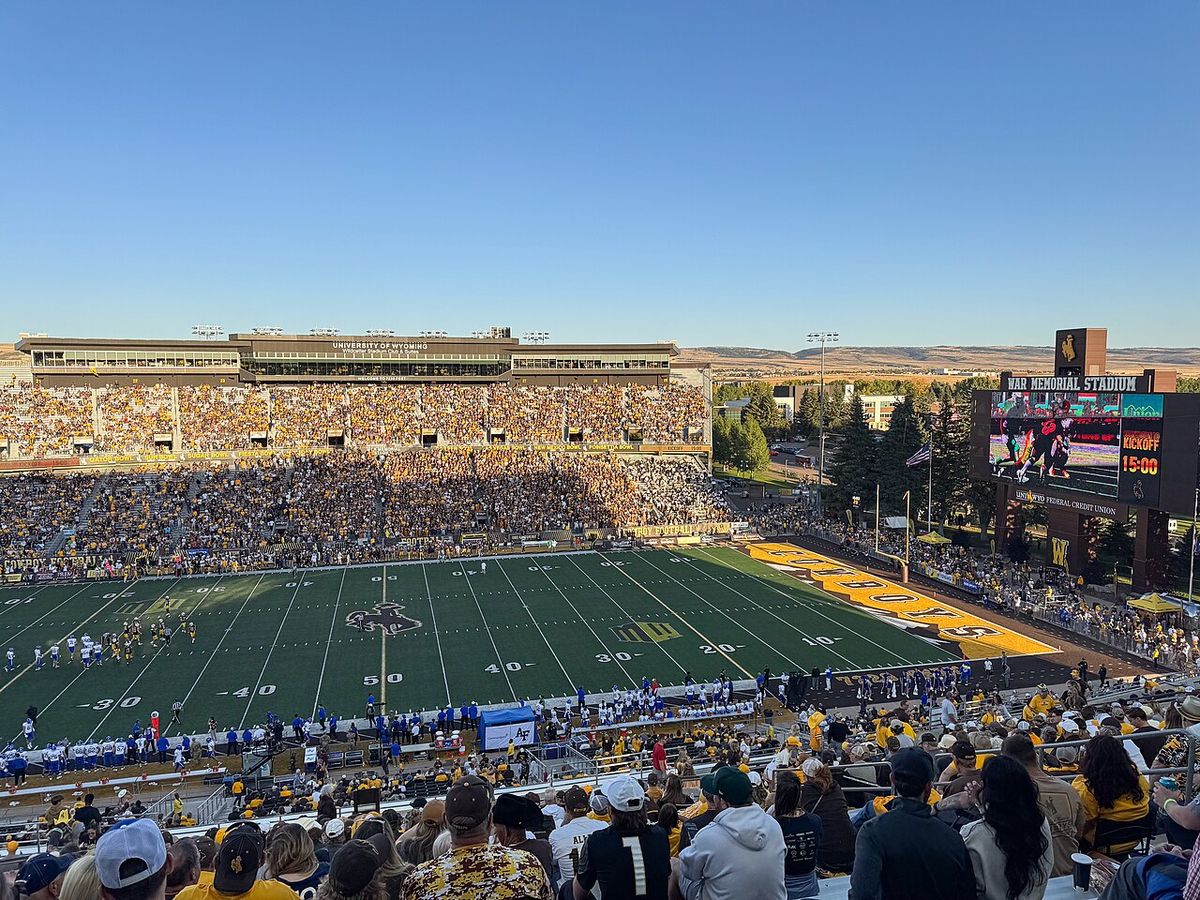

Hawai'i's 2013 trip to Wyoming is the whole reason this question exists, and true to how small the effect is, the result was close either way: Wyoming won a wild 59–56 shootout. Hawai'i lost, but barely, in a game that had no business being that high-scoring in that cold. Small, real effects don't guarantee a bad day; they just tilt the odds a little. UNLV shows the flip side: a Las Vegas team that traveled to 11.9°F at Air Force, the fourth-biggest shock on record, and won anyway, 41–21. One game either way is exactly the kind of story this analysis exists to check instead of trusting.
Every example here is a cold-shock story. Is heat easier?
Fair thing to notice: every game we've highlighted is a warm-weather team hit by surprise cold, never the other way around. Is cold shock actually worse, or does a tropical team in a blizzard just make a better story? We hadn't tested that yet. The finding above treats "30°F warmer than normal" and "30°F colder than normal" as the same thing. So we split them apart.
Neither direction is significant on its own, not even close, with 7,047 warmer-than-normal games and 7,112 colder-than-normal ones. The effect needed the whole pile of games to show up; split in half, it disappears, even though each half is still around 7,000 games. That's a real answer: there's no evidence heat shocks are worse than cold shocks, or the other way around. If anything, the margin effect keeps pointing the same way for cold shocks and flips for hot ones, but that's a hint, not a finding.
A sharper test: among games that actually hit 90°F+ at kickoff (where nearly every visiting team is heat-shocked to some degree), does a bigger heat shock mean a worse day for the visitors? Across 245 of those games: no. Not on turnovers, margin, passing or rushing (all with p > 0.2, which is statistician for "nothing here"). A team that's never felt 90°F+ didn't do measurably worse than a team for whom it's a normal Tuesday. Big caution flag: 245 games without the team or time-of-year checks is a much weaker test than everything else in this post. But it's a useful cross-check for the post about home teams in extreme heat. If wilting visitors explained that home boost, this test should have caught at least a hint. It didn't, which points more toward something about the home stadium (shade, cooling fans) than the visitors not being used to heat.
Put together: the examples on this page are all cold stories not because cold shock is worse (by every test here, it isn't) but probably just because a tropical team in the snow is a better story.
Do the sportsbooks already know?
The effect that survived is about margin (who wins, by how much), so the right thing to compare against is the point spread, the sportsbooks' prediction of the margin. First we confirmed the spread works the way you'd hope: it lines up with the real margin from the visitor's side (a correlation of +0.71, where 1 would be perfect; −0.71 from the home side). Then we checked whether the gap between the real margin and the spread grows as the temperature shock gets bigger.
It doesn't. Across 6,224 road games with a real spread (2017–2025), temperature shock shows no real connection to that gap, and the grouped numbers bounce around with no clear trend (+0.19, +0.05, +0.26 and −1.40 points across the four groups). This time that's a real "no," not a shrug: with that many games, a real effect of this size would probably have shown up. That fits how tiny the effect is to begin with, a few hundredths of a point per degree, compared with the spread's typical miss of about 15 points.
Where this leaves it
It's small, and this is the first test, so it doesn't change anything about our prediction model, which predicts total points, not turnovers or margin (and already got nothing out of plain temperature in the first temperature post). Worth revisiting as more seasons pile up. And worth remembering as this site's best example of why every finding has to survive checks for team strength, home field, time of year and team identity before we trust it.
See the full top 50 biggest temperature shocks on the leaderboard, or catch up on how temperature affects the total and how it changes the way teams play.