RAINKFootball Weather
Findings, methodology notes, and the occasional caught mistake.All posts

The Big 12's Power Shift Was Bigger Than the Big 12

In the last post, we watched the Big 12's power slide from its North to its South in about three seasons, 2002 to 2004. Which made us wonder: was that just one conference's drama, or was the whole country shifting? So we zoomed out. Way out. Every FBS team since 1965, more than 45,000 games, 61 seasons, sorted by where on the map each team lives.

The short version: the Big 12 was the epicenter of something bigger. Texas, Oklahoma, Louisiana and Arkansas went from the weakest part of the country in the 1990s to one of the strongest by the late 2000s, and the sharpest jump came in 2003. The Plains, home to most of the old Big 12 North, faded at the same time. And the Southeast, which everybody would guess is the story of this era? It had already been the boss since the early 1980s. What changed in the SEC era wasn't that the region got stronger; it's that its power got squeezed into fewer programs.
South Central top-25 teams per season, 1990s2.5
… in 2006–20155.7
South Central wins vs. other regions35% → 55%
Seasons studied61

First, a map

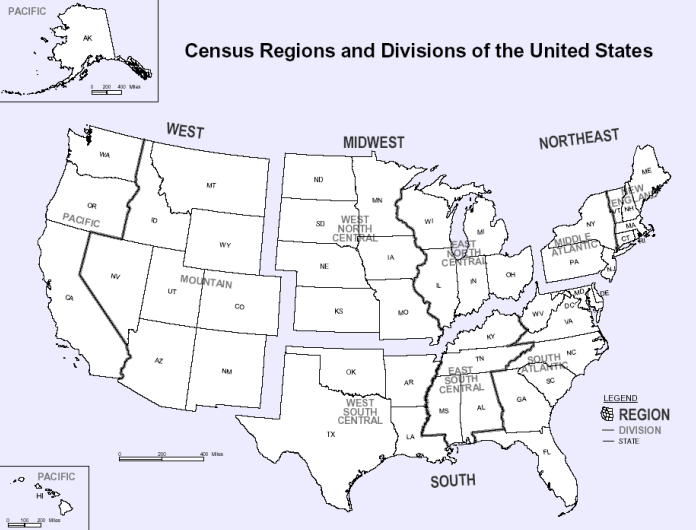
U.S. Census Bureau map dividing the United States into four regions and nine divisions.
The Census Bureau's map of U.S. regions and divisions, which we borrowed to sort every team. Map: U.S. Census Bureau (public domain), via Wikimedia Commons.

Conferences change every few years (see: everything since 2010), so instead we sorted teams by geography. We used the Census Bureau's nine divisions, squished into seven so every region has enough teams:

  • Northeast: New England plus New York, New Jersey and Pennsylvania
  • Great Lakes: Ohio, Indiana, Illinois, Michigan and Wisconsin (yes, Notre Dame counts)
  • Plains: Iowa, Kansas, Minnesota, Missouri, Nebraska and the Dakotas
  • Southeast: the Atlantic coast from Delaware to Florida, plus Kentucky, Tennessee, Alabama and Mississippi
  • South Central: Texas, Oklahoma, Louisiana and Arkansas
  • Mountain: Arizona, Colorado, Idaho, Montana, Nevada, New Mexico, Utah and Wyoming
  • Pacific: California, Oregon, Washington, Alaska and Hawai'i

That means some teams land in surprising spots. Colorado, a Big 12 North team, counts as Mountain. LSU and Texas A&M, both SEC schools today, count as South Central.

How do you compare a 1968 team to a 2018 team?

Carefully. We built a rating for every team in every season using nothing but final scores, adjusted for how good each opponent was and for home field. It's not perfect, but it works the same way in every era, and it agrees closely with SP+, a much fancier rating, in every season where both exist (a typical correlation of 0.94, where 1 is a perfect match). Then we asked a simple question each season: which regions do the 25 best teams come from?

Sixty-one seasons, seven tiny charts

Share of the nation's 25 best-rated teams, by region
NortheastNew England, NY, NJ, PA
0% 20% 40% 1970 1990 2010 Northeast, 1965 (5-season average): 13% of the top 25 Northeast, 1966 (5-season average): 14% of the top 25 Northeast, 1967 (5-season average): 13% of the top 25 Northeast, 1968 (5-season average): 13% of the top 25 Northeast, 1969 (5-season average): 11% of the top 25 Northeast, 1970 (5-season average): 11% of the top 25 Northeast, 1971 (5-season average): 10% of the top 25 Northeast, 1972 (5-season average): 12% of the top 25 Northeast, 1973 (5-season average): 11% of the top 25 Northeast, 1974 (5-season average): 12% of the top 25 Northeast, 1975 (5-season average): 12% of the top 25 Northeast, 1976 (5-season average): 10% of the top 25 Northeast, 1977 (5-season average): 10% of the top 25 Northeast, 1978 (5-season average): 9% of the top 25 Northeast, 1979 (5-season average): 8% of the top 25 Northeast, 1980 (5-season average): 8% of the top 25 Northeast, 1981 (5-season average): 9% of the top 25 Northeast, 1982 (5-season average): 7% of the top 25 Northeast, 1983 (5-season average): 7% of the top 25 Northeast, 1984 (5-season average): 7% of the top 25 Northeast, 1985 (5-season average): 6% of the top 25 Northeast, 1986 (5-season average): 6% of the top 25 Northeast, 1987 (5-season average): 6% of the top 25 Northeast, 1988 (5-season average): 6% of the top 25 Northeast, 1989 (5-season average): 6% of the top 25 Northeast, 1990 (5-season average): 7% of the top 25 Northeast, 1991 (5-season average): 7% of the top 25 Northeast, 1992 (5-season average): 8% of the top 25 Northeast, 1993 (5-season average): 8% of the top 25 Northeast, 1994 (5-season average): 8% of the top 25 Northeast, 1995 (5-season average): 8% of the top 25 Northeast, 1996 (5-season average): 8% of the top 25 Northeast, 1997 (5-season average): 7% of the top 25 Northeast, 1998 (5-season average): 6% of the top 25 Northeast, 1999 (5-season average): 6% of the top 25 Northeast, 2000 (5-season average): 6% of the top 25 Northeast, 2001 (5-season average): 4% of the top 25 Northeast, 2002 (5-season average): 3% of the top 25 Northeast, 2003 (5-season average): 5% of the top 25 Northeast, 2004 (5-season average): 5% of the top 25 Northeast, 2005 (5-season average): 5% of the top 25 Northeast, 2006 (5-season average): 6% of the top 25 Northeast, 2007 (5-season average): 8% of the top 25 Northeast, 2008 (5-season average): 6% of the top 25 Northeast, 2009 (5-season average): 6% of the top 25 Northeast, 2010 (5-season average): 4% of the top 25 Northeast, 2011 (5-season average): 2% of the top 25 Northeast, 2012 (5-season average): 1% of the top 25 Northeast, 2013 (5-season average): 1% of the top 25 Northeast, 2014 (5-season average): 2% of the top 25 Northeast, 2015 (5-season average): 2% of the top 25 Northeast, 2016 (5-season average): 4% of the top 25 Northeast, 2017 (5-season average): 5% of the top 25 Northeast, 2018 (5-season average): 6% of the top 25 Northeast, 2019 (5-season average): 5% of the top 25 Northeast, 2020 (5-season average): 5% of the top 25 Northeast, 2021 (5-season average): 4% of the top 25 Northeast, 2022 (5-season average): 5% of the top 25 Northeast, 2023 (5-season average): 5% of the top 25 Northeast, 2024 (5-season average): 5% of the top 25 Northeast, 2025 (5-season average): 5% of the top 25
Peak 14% (1966) · now 5%
Great LakesOH, IN, IL, MI, WI
0% 20% 40% 1970 1990 2010 Great Lakes, 1965 (5-season average): 16% of the top 25 Great Lakes, 1966 (5-season average): 17% of the top 25 Great Lakes, 1967 (5-season average): 17% of the top 25 Great Lakes, 1968 (5-season average): 17% of the top 25 Great Lakes, 1969 (5-season average): 16% of the top 25 Great Lakes, 1970 (5-season average): 16% of the top 25 Great Lakes, 1971 (5-season average): 16% of the top 25 Great Lakes, 1972 (5-season average): 17% of the top 25 Great Lakes, 1973 (5-season average): 16% of the top 25 Great Lakes, 1974 (5-season average): 17% of the top 25 Great Lakes, 1975 (5-season average): 18% of the top 25 Great Lakes, 1976 (5-season average): 19% of the top 25 Great Lakes, 1977 (5-season average): 18% of the top 25 Great Lakes, 1978 (5-season average): 17% of the top 25 Great Lakes, 1979 (5-season average): 15% of the top 25 Great Lakes, 1980 (5-season average): 14% of the top 25 Great Lakes, 1981 (5-season average): 12% of the top 25 Great Lakes, 1982 (5-season average): 12% of the top 25 Great Lakes, 1983 (5-season average): 11% of the top 25 Great Lakes, 1984 (5-season average): 13% of the top 25 Great Lakes, 1985 (5-season average): 13% of the top 25 Great Lakes, 1986 (5-season average): 13% of the top 25 Great Lakes, 1987 (5-season average): 14% of the top 25 Great Lakes, 1988 (5-season average): 14% of the top 25 Great Lakes, 1989 (5-season average): 13% of the top 25 Great Lakes, 1990 (5-season average): 13% of the top 25 Great Lakes, 1991 (5-season average): 13% of the top 25 Great Lakes, 1992 (5-season average): 14% of the top 25 Great Lakes, 1993 (5-season average): 17% of the top 25 Great Lakes, 1994 (5-season average): 18% of the top 25 Great Lakes, 1995 (5-season average): 20% of the top 25 Great Lakes, 1996 (5-season average): 20% of the top 25 Great Lakes, 1997 (5-season average): 19% of the top 25 Great Lakes, 1998 (5-season average): 18% of the top 25 Great Lakes, 1999 (5-season average): 17% of the top 25 Great Lakes, 2000 (5-season average): 15% of the top 25 Great Lakes, 2001 (5-season average): 14% of the top 25 Great Lakes, 2002 (5-season average): 14% of the top 25 Great Lakes, 2003 (5-season average): 13% of the top 25 Great Lakes, 2004 (5-season average): 14% of the top 25 Great Lakes, 2005 (5-season average): 13% of the top 25 Great Lakes, 2006 (5-season average): 12% of the top 25 Great Lakes, 2007 (5-season average): 11% of the top 25 Great Lakes, 2008 (5-season average): 10% of the top 25 Great Lakes, 2009 (5-season average): 13% of the top 25 Great Lakes, 2010 (5-season average): 15% of the top 25 Great Lakes, 2011 (5-season average): 17% of the top 25 Great Lakes, 2012 (5-season average): 17% of the top 25 Great Lakes, 2013 (5-season average): 20% of the top 25 Great Lakes, 2014 (5-season average): 18% of the top 25 Great Lakes, 2015 (5-season average): 18% of the top 25 Great Lakes, 2016 (5-season average): 18% of the top 25 Great Lakes, 2017 (5-season average): 19% of the top 25 Great Lakes, 2018 (5-season average): 17% of the top 25 Great Lakes, 2019 (5-season average): 18% of the top 25 Great Lakes, 2020 (5-season average): 17% of the top 25 Great Lakes, 2021 (5-season average): 16% of the top 25 Great Lakes, 2022 (5-season average): 15% of the top 25 Great Lakes, 2023 (5-season average): 16% of the top 25 Great Lakes, 2024 (5-season average): 15% of the top 25 Great Lakes, 2025 (5-season average): 15% of the top 25
Peak 20% (1995) · now 15%
PlainsIA, KS, MN, MO, NE, ND, SD
0% 20% 40% 1970 1990 2010 Plains, 1965 (5-season average): 3% of the top 25 Plains, 1966 (5-season average): 4% of the top 25 Plains, 1967 (5-season average): 6% of the top 25 Plains, 1968 (5-season average): 5% of the top 25 Plains, 1969 (5-season average): 6% of the top 25 Plains, 1970 (5-season average): 8% of the top 25 Plains, 1971 (5-season average): 8% of the top 25 Plains, 1972 (5-season average): 6% of the top 25 Plains, 1973 (5-season average): 6% of the top 25 Plains, 1974 (5-season average): 6% of the top 25 Plains, 1975 (5-season average): 6% of the top 25 Plains, 1976 (5-season average): 6% of the top 25 Plains, 1977 (5-season average): 6% of the top 25 Plains, 1978 (5-season average): 6% of the top 25 Plains, 1979 (5-season average): 6% of the top 25 Plains, 1980 (5-season average): 6% of the top 25 Plains, 1981 (5-season average): 7% of the top 25 Plains, 1982 (5-season average): 8% of the top 25 Plains, 1983 (5-season average): 8% of the top 25 Plains, 1984 (5-season average): 8% of the top 25 Plains, 1985 (5-season average): 9% of the top 25 Plains, 1986 (5-season average): 7% of the top 25 Plains, 1987 (5-season average): 6% of the top 25 Plains, 1988 (5-season average): 6% of the top 25 Plains, 1989 (5-season average): 6% of the top 25 Plains, 1990 (5-season average): 6% of the top 25 Plains, 1991 (5-season average): 6% of the top 25 Plains, 1992 (5-season average): 7% of the top 25 Plains, 1993 (5-season average): 8% of the top 25 Plains, 1994 (5-season average): 9% of the top 25 Plains, 1995 (5-season average): 10% of the top 25 Plains, 1996 (5-season average): 11% of the top 25 Plains, 1997 (5-season average): 12% of the top 25 Plains, 1998 (5-season average): 11% of the top 25 Plains, 1999 (5-season average): 11% of the top 25 Plains, 2000 (5-season average): 10% of the top 25 Plains, 2001 (5-season average): 11% of the top 25 Plains, 2002 (5-season average): 10% of the top 25 Plains, 2003 (5-season average): 10% of the top 25 Plains, 2004 (5-season average): 9% of the top 25 Plains, 2005 (5-season average): 9% of the top 25 Plains, 2006 (5-season average): 7% of the top 25 Plains, 2007 (5-season average): 7% of the top 25 Plains, 2008 (5-season average): 8% of the top 25 Plains, 2009 (5-season average): 7% of the top 25 Plains, 2010 (5-season average): 6% of the top 25 Plains, 2011 (5-season average): 6% of the top 25 Plains, 2012 (5-season average): 6% of the top 25 Plains, 2013 (5-season average): 4% of the top 25 Plains, 2014 (5-season average): 3% of the top 25 Plains, 2015 (5-season average): 4% of the top 25 Plains, 2016 (5-season average): 5% of the top 25 Plains, 2017 (5-season average): 4% of the top 25 Plains, 2018 (5-season average): 6% of the top 25 Plains, 2019 (5-season average): 6% of the top 25 Plains, 2020 (5-season average): 6% of the top 25 Plains, 2021 (5-season average): 6% of the top 25 Plains, 2022 (5-season average): 6% of the top 25 Plains, 2023 (5-season average): 6% of the top 25 Plains, 2024 (5-season average): 6% of the top 25 Plains, 2025 (5-season average): 5% of the top 25
Peak 12% (1997) · now 5%
SoutheastAtlantic coast from DE to FL, plus KY, TN, AL, MS
0% 20% 40% 1970 1990 2010 Southeast, 1965 (5-season average): 28% of the top 25 Southeast, 1966 (5-season average): 26% of the top 25 Southeast, 1967 (5-season average): 25% of the top 25 Southeast, 1968 (5-season average): 22% of the top 25 Southeast, 1969 (5-season average): 22% of the top 25 Southeast, 1970 (5-season average): 23% of the top 25 Southeast, 1971 (5-season average): 23% of the top 25 Southeast, 1972 (5-season average): 24% of the top 25 Southeast, 1973 (5-season average): 25% of the top 25 Southeast, 1974 (5-season average): 22% of the top 25 Southeast, 1975 (5-season average): 20% of the top 25 Southeast, 1976 (5-season average): 21% of the top 25 Southeast, 1977 (5-season average): 21% of the top 25 Southeast, 1978 (5-season average): 23% of the top 25 Southeast, 1979 (5-season average): 26% of the top 25 Southeast, 1980 (5-season average): 27% of the top 25 Southeast, 1981 (5-season average): 30% of the top 25 Southeast, 1982 (5-season average): 34% of the top 25 Southeast, 1983 (5-season average): 35% of the top 25 Southeast, 1984 (5-season average): 34% of the top 25 Southeast, 1985 (5-season average): 36% of the top 25 Southeast, 1986 (5-season average): 34% of the top 25 Southeast, 1987 (5-season average): 32% of the top 25 Southeast, 1988 (5-season average): 32% of the top 25 Southeast, 1989 (5-season average): 35% of the top 25 Southeast, 1990 (5-season average): 34% of the top 25 Southeast, 1991 (5-season average): 37% of the top 25 Southeast, 1992 (5-season average): 37% of the top 25 Southeast, 1993 (5-season average): 35% of the top 25 Southeast, 1994 (5-season average): 34% of the top 25 Southeast, 1995 (5-season average): 33% of the top 25 Southeast, 1996 (5-season average): 31% of the top 25 Southeast, 1997 (5-season average): 33% of the top 25 Southeast, 1998 (5-season average): 36% of the top 25 Southeast, 1999 (5-season average): 35% of the top 25 Southeast, 2000 (5-season average): 36% of the top 25 Southeast, 2001 (5-season average): 38% of the top 25 Southeast, 2002 (5-season average): 36% of the top 25 Southeast, 2003 (5-season average): 34% of the top 25 Southeast, 2004 (5-season average): 34% of the top 25 Southeast, 2005 (5-season average): 32% of the top 25 Southeast, 2006 (5-season average): 28% of the top 25 Southeast, 2007 (5-season average): 27% of the top 25 Southeast, 2008 (5-season average): 26% of the top 25 Southeast, 2009 (5-season average): 26% of the top 25 Southeast, 2010 (5-season average): 26% of the top 25 Southeast, 2011 (5-season average): 29% of the top 25 Southeast, 2012 (5-season average): 30% of the top 25 Southeast, 2013 (5-season average): 32% of the top 25 Southeast, 2014 (5-season average): 34% of the top 25 Southeast, 2015 (5-season average): 38% of the top 25 Southeast, 2016 (5-season average): 38% of the top 25 Southeast, 2017 (5-season average): 39% of the top 25 Southeast, 2018 (5-season average): 41% of the top 25 Southeast, 2019 (5-season average): 42% of the top 25 Southeast, 2020 (5-season average): 40% of the top 25 Southeast, 2021 (5-season average): 39% of the top 25 Southeast, 2022 (5-season average): 38% of the top 25 Southeast, 2023 (5-season average): 34% of the top 25 Southeast, 2024 (5-season average): 33% of the top 25 Southeast, 2025 (5-season average): 32% of the top 25
Peak 42% (2019) · now 32%
South CentralTX, OK, LA, AR
0% 20% 40% 1970 1990 2010 South Central, 1965 (5-season average): 21% of the top 25 South Central, 1966 (5-season average): 20% of the top 25 South Central, 1967 (5-season average): 19% of the top 25 South Central, 1968 (5-season average): 20% of the top 25 South Central, 1969 (5-season average): 20% of the top 25 South Central, 1970 (5-season average): 19% of the top 25 South Central, 1971 (5-season average): 21% of the top 25 South Central, 1972 (5-season average): 23% of the top 25 South Central, 1973 (5-season average): 25% of the top 25 South Central, 1974 (5-season average): 26% of the top 25 South Central, 1975 (5-season average): 26% of the top 25 South Central, 1976 (5-season average): 26% of the top 25 South Central, 1977 (5-season average): 26% of the top 25 South Central, 1978 (5-season average): 24% of the top 25 South Central, 1979 (5-season average): 23% of the top 25 South Central, 1980 (5-season average): 22% of the top 25 South Central, 1981 (5-season average): 20% of the top 25 South Central, 1982 (5-season average): 18% of the top 25 South Central, 1983 (5-season average): 18% of the top 25 South Central, 1984 (5-season average): 18% of the top 25 South Central, 1985 (5-season average): 17% of the top 25 South Central, 1986 (5-season average): 18% of the top 25 South Central, 1987 (5-season average): 17% of the top 25 South Central, 1988 (5-season average): 17% of the top 25 South Central, 1989 (5-season average): 14% of the top 25 South Central, 1990 (5-season average): 12% of the top 25 South Central, 1991 (5-season average): 10% of the top 25 South Central, 1992 (5-season average): 8% of the top 25 South Central, 1993 (5-season average): 9% of the top 25 South Central, 1994 (5-season average): 8% of the top 25 South Central, 1995 (5-season average): 9% of the top 25 South Central, 1996 (5-season average): 10% of the top 25 South Central, 1997 (5-season average): 12% of the top 25 South Central, 1998 (5-season average): 11% of the top 25 South Central, 1999 (5-season average): 14% of the top 25 South Central, 2000 (5-season average): 14% of the top 25 South Central, 2001 (5-season average): 14% of the top 25 South Central, 2002 (5-season average): 17% of the top 25 South Central, 2003 (5-season average): 18% of the top 25 South Central, 2004 (5-season average): 19% of the top 25 South Central, 2005 (5-season average): 21% of the top 25 South Central, 2006 (5-season average): 22% of the top 25 South Central, 2007 (5-season average): 23% of the top 25 South Central, 2008 (5-season average): 24% of the top 25 South Central, 2009 (5-season average): 25% of the top 25 South Central, 2010 (5-season average): 24% of the top 25 South Central, 2011 (5-season average): 23% of the top 25 South Central, 2012 (5-season average): 22% of the top 25 South Central, 2013 (5-season average): 22% of the top 25 South Central, 2014 (5-season average): 21% of the top 25 South Central, 2015 (5-season average): 20% of the top 25 South Central, 2016 (5-season average): 18% of the top 25 South Central, 2017 (5-season average): 18% of the top 25 South Central, 2018 (5-season average): 18% of the top 25 South Central, 2019 (5-season average): 18% of the top 25 South Central, 2020 (5-season average): 18% of the top 25 South Central, 2021 (5-season average): 20% of the top 25 South Central, 2022 (5-season average): 20% of the top 25 South Central, 2023 (5-season average): 21% of the top 25 South Central, 2024 (5-season average): 20% of the top 25 South Central, 2025 (5-season average): 21% of the top 25
Peak 26% (1977) · now 21%
MountainAZ, CO, ID, MT, NV, NM, UT, WY
0% 20% 40% 1970 1990 2010 Mountain, 1965 (5-season average): 11% of the top 25 Mountain, 1966 (5-season average): 10% of the top 25 Mountain, 1967 (5-season average): 10% of the top 25 Mountain, 1968 (5-season average): 12% of the top 25 Mountain, 1969 (5-season average): 11% of the top 25 Mountain, 1970 (5-season average): 10% of the top 25 Mountain, 1971 (5-season average): 9% of the top 25 Mountain, 1972 (5-season average): 6% of the top 25 Mountain, 1973 (5-season average): 6% of the top 25 Mountain, 1974 (5-season average): 6% of the top 25 Mountain, 1975 (5-season average): 6% of the top 25 Mountain, 1976 (5-season average): 6% of the top 25 Mountain, 1977 (5-season average): 7% of the top 25 Mountain, 1978 (5-season average): 8% of the top 25 Mountain, 1979 (5-season average): 9% of the top 25 Mountain, 1980 (5-season average): 10% of the top 25 Mountain, 1981 (5-season average): 12% of the top 25 Mountain, 1982 (5-season average): 12% of the top 25 Mountain, 1983 (5-season average): 13% of the top 25 Mountain, 1984 (5-season average): 12% of the top 25 Mountain, 1985 (5-season average): 10% of the top 25 Mountain, 1986 (5-season average): 10% of the top 25 Mountain, 1987 (5-season average): 10% of the top 25 Mountain, 1988 (5-season average): 9% of the top 25 Mountain, 1989 (5-season average): 9% of the top 25 Mountain, 1990 (5-season average): 10% of the top 25 Mountain, 1991 (5-season average): 10% of the top 25 Mountain, 1992 (5-season average): 10% of the top 25 Mountain, 1993 (5-season average): 10% of the top 25 Mountain, 1994 (5-season average): 13% of the top 25 Mountain, 1995 (5-season average): 11% of the top 25 Mountain, 1996 (5-season average): 11% of the top 25 Mountain, 1997 (5-season average): 10% of the top 25 Mountain, 1998 (5-season average): 10% of the top 25 Mountain, 1999 (5-season average): 8% of the top 25 Mountain, 2000 (5-season average): 8% of the top 25 Mountain, 2001 (5-season average): 7% of the top 25 Mountain, 2002 (5-season average): 8% of the top 25 Mountain, 2003 (5-season average): 7% of the top 25 Mountain, 2004 (5-season average): 6% of the top 25 Mountain, 2005 (5-season average): 8% of the top 25 Mountain, 2006 (5-season average): 10% of the top 25 Mountain, 2007 (5-season average): 10% of the top 25 Mountain, 2008 (5-season average): 13% of the top 25 Mountain, 2009 (5-season average): 12% of the top 25 Mountain, 2010 (5-season average): 12% of the top 25 Mountain, 2011 (5-season average): 10% of the top 25 Mountain, 2012 (5-season average): 9% of the top 25 Mountain, 2013 (5-season average): 7% of the top 25 Mountain, 2014 (5-season average): 7% of the top 25 Mountain, 2015 (5-season average): 4% of the top 25 Mountain, 2016 (5-season average): 4% of the top 25 Mountain, 2017 (5-season average): 5% of the top 25 Mountain, 2018 (5-season average): 6% of the top 25 Mountain, 2019 (5-season average): 6% of the top 25 Mountain, 2020 (5-season average): 7% of the top 25 Mountain, 2021 (5-season average): 6% of the top 25 Mountain, 2022 (5-season average): 8% of the top 25 Mountain, 2023 (5-season average): 8% of the top 25 Mountain, 2024 (5-season average): 8% of the top 25 Mountain, 2025 (5-season average): 9% of the top 25
Peak 13% (1983) · now 9%
PacificCA, OR, WA, AK, HI
0% 20% 40% 1970 1990 2010 Pacific, 1965 (5-season average): 8% of the top 25 Pacific, 1966 (5-season average): 9% of the top 25 Pacific, 1967 (5-season average): 10% of the top 25 Pacific, 1968 (5-season average): 12% of the top 25 Pacific, 1969 (5-season average): 13% of the top 25 Pacific, 1970 (5-season average): 13% of the top 25 Pacific, 1971 (5-season average): 13% of the top 25 Pacific, 1972 (5-season average): 11% of the top 25 Pacific, 1973 (5-season average): 11% of the top 25 Pacific, 1974 (5-season average): 11% of the top 25 Pacific, 1975 (5-season average): 13% of the top 25 Pacific, 1976 (5-season average): 13% of the top 25 Pacific, 1977 (5-season average): 13% of the top 25 Pacific, 1978 (5-season average): 13% of the top 25 Pacific, 1979 (5-season average): 13% of the top 25 Pacific, 1980 (5-season average): 12% of the top 25 Pacific, 1981 (5-season average): 10% of the top 25 Pacific, 1982 (5-season average): 10% of the top 25 Pacific, 1983 (5-season average): 8% of the top 25 Pacific, 1984 (5-season average): 9% of the top 25 Pacific, 1985 (5-season average): 9% of the top 25 Pacific, 1986 (5-season average): 11% of the top 25 Pacific, 1987 (5-season average): 14% of the top 25 Pacific, 1988 (5-season average): 15% of the top 25 Pacific, 1989 (5-season average): 16% of the top 25 Pacific, 1990 (5-season average): 17% of the top 25 Pacific, 1991 (5-season average): 17% of the top 25 Pacific, 1992 (5-season average): 15% of the top 25 Pacific, 1993 (5-season average): 14% of the top 25 Pacific, 1994 (5-season average): 10% of the top 25 Pacific, 1995 (5-season average): 10% of the top 25 Pacific, 1996 (5-season average): 8% of the top 25 Pacific, 1997 (5-season average): 6% of the top 25 Pacific, 1998 (5-season average): 7% of the top 25 Pacific, 1999 (5-season average): 10% of the top 25 Pacific, 2000 (5-season average): 10% of the top 25 Pacific, 2001 (5-season average): 11% of the top 25 Pacific, 2002 (5-season average): 13% of the top 25 Pacific, 2003 (5-season average): 14% of the top 25 Pacific, 2004 (5-season average): 14% of the top 25 Pacific, 2005 (5-season average): 13% of the top 25 Pacific, 2006 (5-season average): 14% of the top 25 Pacific, 2007 (5-season average): 13% of the top 25 Pacific, 2008 (5-season average): 12% of the top 25 Pacific, 2009 (5-season average): 12% of the top 25 Pacific, 2010 (5-season average): 13% of the top 25 Pacific, 2011 (5-season average): 13% of the top 25 Pacific, 2012 (5-season average): 14% of the top 25 Pacific, 2013 (5-season average): 14% of the top 25 Pacific, 2014 (5-season average): 15% of the top 25 Pacific, 2015 (5-season average): 14% of the top 25 Pacific, 2016 (5-season average): 12% of the top 25 Pacific, 2017 (5-season average): 10% of the top 25 Pacific, 2018 (5-season average): 8% of the top 25 Pacific, 2019 (5-season average): 5% of the top 25 Pacific, 2020 (5-season average): 6% of the top 25 Pacific, 2021 (5-season average): 8% of the top 25 Pacific, 2022 (5-season average): 8% of the top 25 Pacific, 2023 (5-season average): 10% of the top 25 Pacific, 2024 (5-season average): 13% of the top 25 Pacific, 2025 (5-season average): 12% of the top 25
Peak 17% (1990) · now 12%
Five-season averages. In each panel, the blue line is that region and the gray lines are the other six. The shaded band is 2002–2004, when the Big 12 flipped. Hover a line for a season's value.
See the numbers by five-year stretch
% of the top 251965–691970–741975–791980–841985–891990–941995–992000–042005–092010–142015–192020–24
Northeast131210768738155
Great Lakes171718121414191411171915
Plains66686712107646
Southeast252421343237333627303938
South Central19232618178121723221820
Mountain106712101010810958
Pacific1011131014156131314108

Here's the story those lines tell, era by era.

1965–79 The Big Ten and Texas run the show

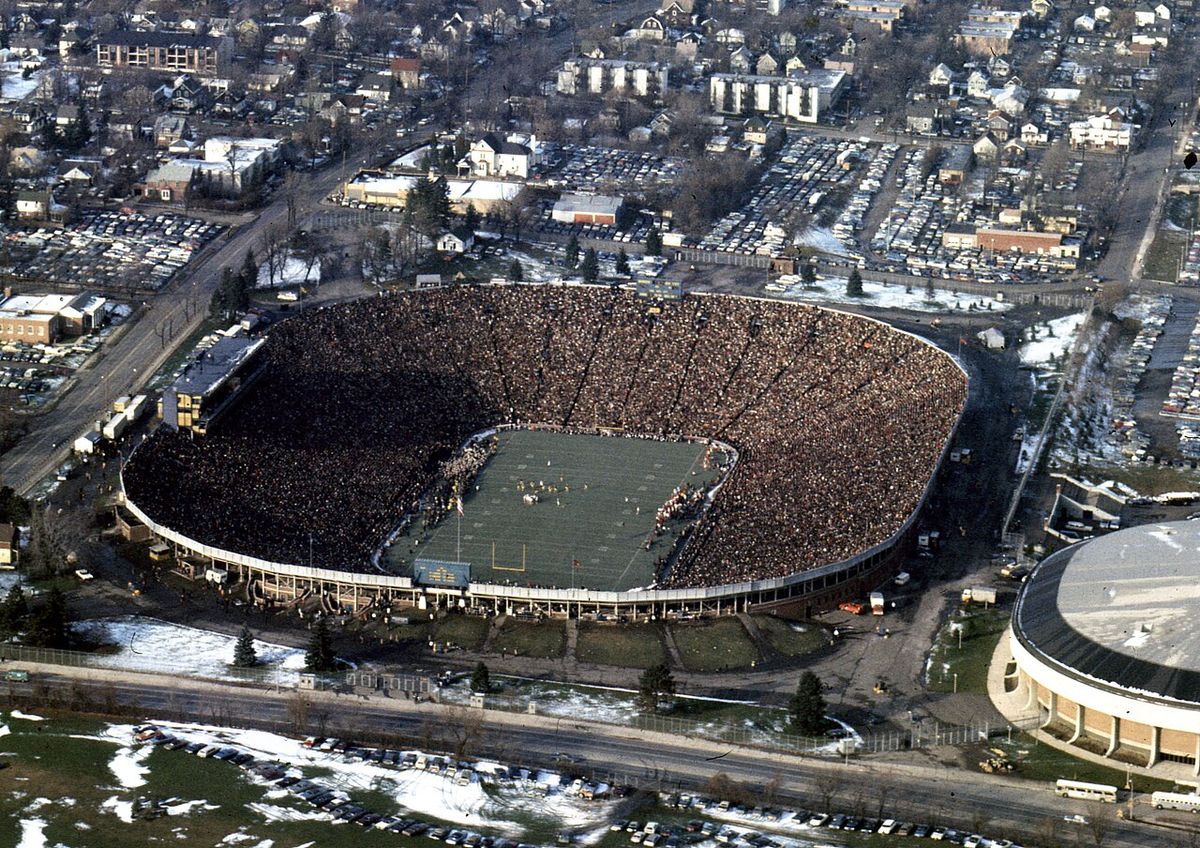
Aerial photo of a packed Michigan Stadium in November 1969, with snow on the ground outside.
Michigan Stadium on Nov. 22, 1969, the day Michigan knocked off an 8–0 Ohio State, 24–12. The Great Lakes owned this era. Photo: University of Michigan News and Information Services, University of Michigan Libraries, CC BY 4.0, via Wikimedia Commons.

Back then, the powers were the Great Lakes (the Big Ten plus Notre Dame) and South Central (Texas, Oklahoma, Arkansas and the old Southwest Conference). Between 1965 and 1979 they piled up 37 and 32 AP top-10 finishes. Two weeks after that Michigan game, Texas beat Arkansas 15–14 and went on to win the national title. South Central peaked at 26% of the top 25 in 1975–79.

1980s–90s The Southeast takes the throne

Around 1981, the Southeast put about three more teams a season into the top 25, and it has had the biggest share of the top 25 in every five-year stretch since. Forty-plus years at the top. That's not a streak; that's a dynasty.

South Central, meanwhile, fell off a cliff. By 1990–94 it had just 8% of the top 25, and in the 1990s it won only 35% of its games against teams from other regions. That's the worst record of any region in any decade since 1965. (The old Southwest Conference, home of most of those Texas schools, broke up after the 1995 season.)

2000s–10s Texas and friends come roaring back

This is the national version of the Big 12 story, and it gets its own section below.

2020s The Big Ten strikes back

Plot twist for the current era: the Great Lakes is back. It had 16 AP top-10 finishes in 2020–24, the most for the region in any five-year stretch since 1965, and national titles for Michigan (2023), Ohio State (2024) and Indiana (2025). Indiana. Let that sink in.

So what changed around 2003?

Let's compare the decade before the Big 12 flip (1990–99) with the decade after it (2006–15), skipping the messy years in between:

RegionTop-25 teams per seasonAP top-10 finishes per seasonWin % vs. other regions
Northeast1.9 → 0.90.5 → 0.343% → 42%
Great Lakes4.2 → 3.81.6 → 1.747% → 50%
Plains2.4 → 1.51.2 → 0.553% → 49%
Southeast8.7 → 7.34.6 → 3.466% → 53%
South Central2.5 → 5.70.5 → 2.235% → 55%
Mountain2.6 → 2.50.9 → 0.556% → 41%
Pacific2.7 → 3.30.7 → 1.547% → 55%

South Central wins "most improved" in a landslide. It went from 2.5 to 5.7 top-25 teams a season and from 0.5 to 2.2 AP top-10 finishes, and its record against other regions went from 35% to 55%. Its average team went from 2.7 points per game worse than an average FBS team to 0.8 points better. And the year with the sharpest jump? 2003, right when the Big 12 South was taking over.

The other half of the Big 12 story shows up nationally too. The Plains dropped from 2.4 to 1.5 top-25 teams a season and from 1.2 to 0.5 AP top-10 finishes. The Mountain region, which includes Colorado, went from winning 56% of its games against other regions to 41%. Ouch.

It wasn't just the Big 12 South

A bronze tiger statue in front of LSU's Tiger Stadium, lit up at night.
LSU's Tiger Stadium. No program in the region climbed further: from 2 top-25 seasons in the 1990s to 9 in 2006–15. Photo: getmahesh, CC BY-SA 2.0, via Wikimedia Commons.
Top-25 seasons, 1990–99 vs. 2006–15
South Central
LSU2 → 9
TCU0 → 7
Oklahoma4 → 10
Oklahoma State0 → 6
Arkansas2 → 6
Texas5 → 4
Texas A&M8 → 4
Plains
Missouri1 → 6
Iowa5 → 2
Kansas State6 → 2
Nebraska10 → 4
Southeast
Clemson3 → 7
Ole Miss0 → 4
South Carolina0 → 4
Alabama6 → 8
Florida State10 → 6
Florida9 → 5
Miami9 → 1
Tennessee10 → 2
Seasons in our rating's top 25 in each ten-year stretch. Blue bars are gains, red bars are losses.

South Central's comeback was a group project. LSU went from 2 top-25 seasons to 9, winning the BCS title after the 2003 season and the AP title in 2007 along the way. TCU, which didn't even join the Big 12 until 2012, went from 0 to 7. Oklahoma went from 4 to 10, Oklahoma State from 0 to 6, and Arkansas from 2 to 6. Texas was good in both decades (5 and 4). The one program that went the wrong way was Texas A&M, the region's best of the 1990s by this count, which slid from 8 to 4.

Up in the Plains, Nebraska went from 10 top-25 seasons to 4, Kansas State from 6 to 2 and Iowa from 5 to 2. Missouri was the rebel, climbing from 1 to 6.

The Southeast was already the boss

Fans in crimson walk away from Bryant-Denny Stadium at the University of Alabama on a sunny day.
Fans leaving Alabama's Bryant–Denny Stadium after the 2010 spring game. By the 2010s, the Southeast's power ran through a few programs like this one. Photo: Carol M. Highsmith, Library of Congress (public domain), via Wikimedia Commons.

Ask any fan to name the big regional story of the 2000s and 2010s and they'll say "the SEC," probably loudly. But by our numbers, the Southeast didn't rise in that period. It was already on top, and it actually slipped. From the 1990s to 2006–15, its top-25 teams per season fell from 8.7 to 7.3 and its record against other regions from 66% to 53%, even as its national titles went up from 6 to 8.

How can a region win more titles while getting weaker? Depth. In the 1990s, four Southeast programs were in the top 25 almost every year: Florida State and Tennessee (10 seasons each) and Florida and Miami (9 each). That's 38 top-25 seasons between them. By 2006–15, those same four had 14. Alabama (6 to 8) and Clemson (3 to 7) rose, along with Ole Miss and South Carolina (0 to 4 each), but the region's power got packed into a smaller group at the very top. The Southeast also added a lot of new FBS programs, growing from about a quarter of all FBS teams in the 1990s to about a third today. The 13 newcomers since 1995 averaged 4.5 points a game worse than an average FBS team in 2006–15. Leave them out, and the rest of the Southeast was exactly as strong as it had been in the 1990s. The old guard didn't get weaker on average; the region just got bigger and more lopsided.

Data: every FBS score, final AP polls and SP+ ratings (1970 on) from CollegeFootballData.com. The AP ranked only 10 teams through 1967, so we counted top-10 finishes throughout. Our scores-only rating gives nearly the same regional results as SP+ (r = 0.97). Records against other regions include home-and-home and "buy" games, which bigger programs tend to win, but bowl games alone, played mostly on neutral fields, point the same way: South Central won 39% of its bowls against other regions in the 1990s, 48% in the 2000s and 59% in the 2010s. The year-by-year timing is a description, not a formal test; 61 seasons isn't enough data to prove exactly when a shift began.