
How the Big 12 South Took Over
Picture college football in 1996. The Big 12 has just been born: the old Big Eight plus four Texas schools from the Southwest Conference. Nebraska has won back-to-back national titles and is running the ball down everyone's throat. The North is where the monsters live. Fifteen years later? The North has been reduced to a punchline, and Oklahoma and Texas run the place. So what happened? We went through every game from 1996 to 2010 to find out.

Wait, who was in which division?
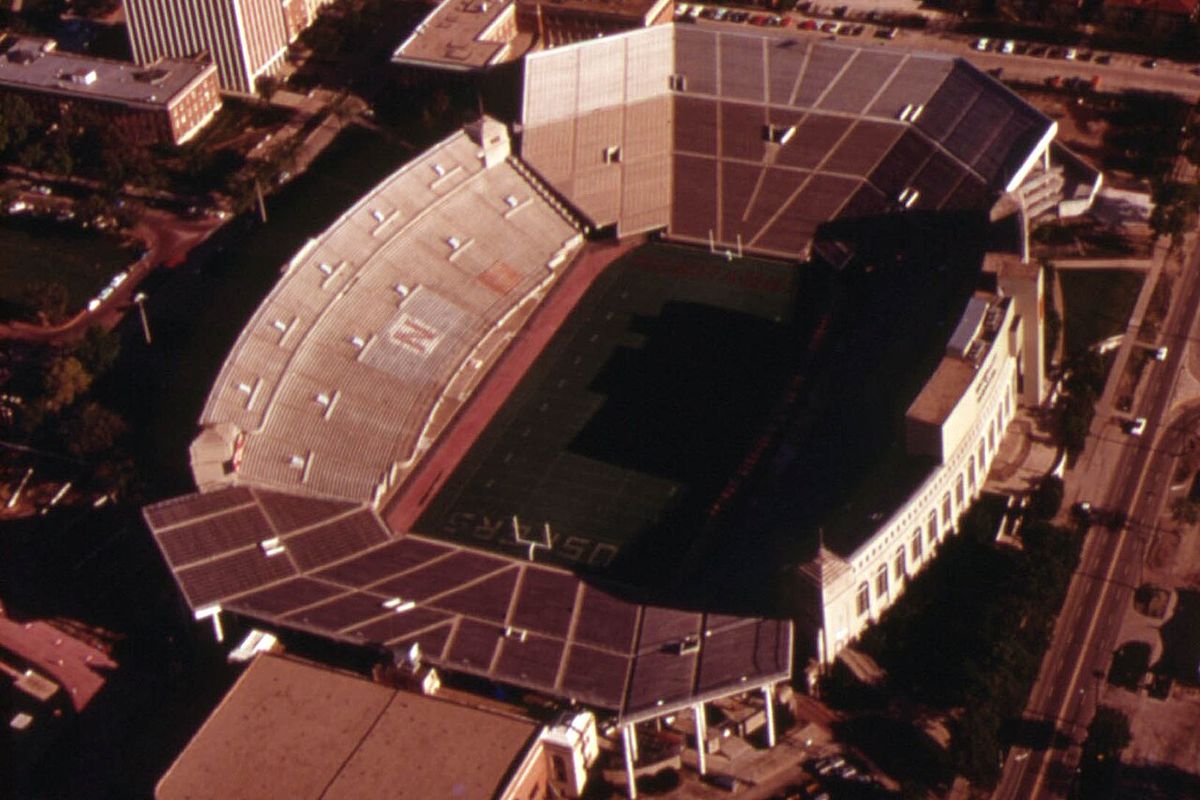
North: Colorado, Iowa State, Kansas, Kansas State, Missouri and Nebraska. South: Baylor, Oklahoma, Oklahoma State, Texas, Texas A&M and Texas Tech. Those lineups never changed from 1996 to 2010. After that, the league blew itself up: Colorado and Nebraska left after 2010, and Missouri and Texas A&M after 2011.
The scoreboard doesn't lie
Every season, each team played three teams from the other division. That's 18 North-versus-South games a year, a built-in cage match. So let's just count who won them.
From 1996 to 2000, the North won 57% of those games and had 9 of the league's 10 teams that finished in the final AP top 10. Then the floor tilted. The South pulled even in 2001, won 11 of 18 in 2002, and in 2004 it went 15–3. From 2001 on, the South won 63% of the cage matches in the first five years and 68% in the next five, had 14 top-10 finishes to the North's 5, and won 8 of 10 title games. Kansas State won it in 2003. The North never won it again.
Spoiler: it was the offense
To see why the South got better, we split every team into its offense and its defense and asked where the change happened.
How do you grade an offense fairly?
Scoring 40 against a terrible defense isn't the same as scoring 40 against a great one. So we used SP+, a rating system that adjusts for who you played. Then we turned it into a percentile: a 90th-percentile offense is better than 90% of the offenses in the country that year. 50 is dead average.
Look at the left chart: the two offense lines swap places around 2002 and never swap back. Now look at the right one. The defense lines basically hold hands the whole time. Here it is in points per game, South minus North (a positive number means the South was better):
| Years | Offense | Defense | Total |
|---|---|---|---|
| 1996–2000 | −4.8 | −1.0 | −5.8 |
| 2001–2005 | +4.7 | −0.7 | +4.1 |
| 2006–2010 | +6.1 | +1.7 | +7.8 |
The offensive gap swung by about 11 points a game. The defensive gap moved less than 3. And in case you're wondering whether SP+ is making this up: we built our own rating using nothing but final scores, and it matched SP+ closely every single season (a correlation between 0.88 and 0.97, where 1 would be a perfect match). Same story: the offensive gap went from −3.1 to +4.0, the defensive gap from −0.5 to +1.4.
Who got better, and who fell off
Texas Tech went from a below-average offense to something out of a video game: +15.5 points a game. Oklahoma State (+13.0) and Oklahoma (+10.8) weren't far behind. Texas barely moved, but only because it was already one of the league's best offenses in the late '90s.
Meanwhile, the only four offenses that got worse were all in the North: Colorado (−8.8), Nebraska (−7.5), Kansas State (−6.3) and Iowa State (−4.5). Missouri and Kansas were the North's rebels, and Missouri's offense was good enough to drag it to the title game in 2007 and 2008. The handoff was total: a North team had the league's best offense every year from 1996 to 2000, and a South team had it every year from 2001 to 2010.
One asterisk on "defense didn't matter": the South's top dogs did get tougher. Oklahoma's defense improved by 8.6 points a game and Texas's by 10.6. But Texas A&M's defense fell apart by 9.0 points over the same stretch, so the division as a whole came out about even.
Points, points everywhere
This wasn't only a North–South thing. The whole league turned into a shootout. In 1996–2000, Big 12 games produced 0.7 more points per team than the national average. By 2006–2010 it was 2.7 more. The peak was 2008, when Big 12 teams averaged 33.6 points in league games, 7.4 more than the national average. Scoreboard operators in Lubbock and Norman earned their paychecks that year.
What the title-game teams looked like
| Year | Champion | Off | Def | Score | Runner-up | Off | Def |
|---|---|---|---|---|---|---|---|
| 1996 | SouthTexas | 93 | 61 | 37–27 | NorthNebraska | 99 | 94 |
| 1997 | NorthNebraska | 100 | 78 | 54–15 | SouthTexas A&M | 75 | 67 |
| 1998 | SouthTexas A&M | 64 | 99 | 36–33 | NorthKansas State | 99 | 76 |
| 1999 | NorthNebraska | 96 | 100 | 22–6 | SouthTexas | 82 | 71 |
| 2000 | SouthOklahoma | 95 | 98 | 27–24 | NorthKansas State | 94 | 75 |
| 2001 | NorthColorado | 91 | 73 | 39–37 | SouthTexas | 94 | 81 |
| 2002 | SouthOklahoma | 97 | 90 | 29–7 | NorthColorado | 85 | 79 |
| 2003 | NorthKansas State | 94 | 92 | 35–7 | SouthOklahoma | 98 | 85 |
| 2004 | SouthOklahoma | 95 | 92 | 42–3 | NorthColorado | 57 | 68 |
| 2005 | SouthTexas | 99 | 92 | 70–3 | NorthColorado | 53 | 84 |
| 2006 | SouthOklahoma | 87 | 91 | 21–7 | NorthNebraska | 74 | 76 |
| 2007 | SouthOklahoma | 98 | 89 | 38–17 | NorthMissouri | 98 | 58 |
| 2008 | SouthOklahoma | 100 | 82 | 62–21 | NorthMissouri | 96 | 60 |
| 2009 | SouthTexas | 92 | 96 | 13–12 | NorthNebraska | 46 | 99 |
| 2010 | SouthOklahoma | 87 | 90 | 23–20 | NorthNebraska | 66 | 94 |
Off and Def are national percentiles. Here's the pattern: the champion almost always had a scary offense. Fourteen of the 15 were in the top 15% of the country on offense, and 11 of 15 were on defense too. On average, champions sat at the 92.5th percentile on offense and 88.2nd on defense, versus 81.1 and 77.8 for the teams they beat.
The North's title-game teams tell a sad little story. From 1996 to 2000 they were monsters on both sides of the ball (98th percentile on offense, 85th on defense). After that, the North kept sending teams that could only do one thing. Missouri in 2007 and 2008 was all offense. Bo Pelini's Nebraska in 2009 and 2010 was all defense, with a 99th-percentile defense in 2009 and an offense worse than half the country. And Colorado in 2004 and 2005 was… there. The South's title-game teams from 2001 on were good at everything: 93rd to 97th percentile on offense and 88th to 89th on defense.
The air raid lands in the South

Now the fun part: running versus passing. Here's how often every team threw the ball, all 15 seasons.
The whole league went from throwing on 34.5% of its plays in 1997 to 51.3% in 2007. But the South got there first, and fast. It threw on 34.0% of its plays in 1998, 44.8% in 1999, then 51.6% and 53.3% in 2000 and 2001. Two coaching hires lit the fuse. Oklahoma went from 26% passes in 1998 to 63% in 1999, Bob Stoops's first season. Texas Tech went from 37% in 1999 to 67% in 2000, Mike Leach's first. A couple of seasons later, the South's offenses passed the North's.
The North? It kept running. It stayed between 34% and 40% passes every year through 2003, and Nebraska threw on just 19–25% of its plays every season from 1996 to 2003. The option offense was Nebraska's whole personality. In 2004, Bill Callahan's first season, Nebraska suddenly threw 44% of the time, and the North as a whole peaked at 51.7% in 2007 before backing off to 42.2% in 2010.
Throwing a lot ≠ throwing well
So the passing teams won, right? Not so fast. We checked how closely each stat lined up with how good an offense was, on a scale where 0 means "no connection at all" and 1 means "perfect match."
- How often a team threw: −0.16, 0.03 and 0.14 across the three five-year stretches. Basically nothing.
- How many yards it gained per throw: 0.69, 0.69 and 0.84. That's a lot.
The title games say the same thing. Champions actually threw a little less often than the teams they beat (39.1% of plays versus 42.4%), but gained more per throw (8.2 yards versus 7.7). Nebraska won the 1997 Big 12 title throwing on 19.4% of its plays. Part of that is just how winning works: when you're up by 30, you run the ball to burn the clock. And quarterback runs, like the ones Vince Young made famous in 2005, count as rushes.

Timing isn't proof of cause. The South's pass-happy offenses showed up alongside new coaches and, as far as our recruiting data reaches, more talent. But the order of events is clear: the passing turn came first, and what separated the great offenses from the rest was efficiency, not volume.
What about recruiting?
Our recruiting data starts with the 2002 class. From then through 2010, the South out-recruited the North every single year, with Texas (average national class rank: 6th) and Oklahoma (8th) way out in front. We can't see far enough back to know whether recruiting caused the shift or followed it. But here's the fun counterexample: Texas Tech had the biggest offensive glow-up in the league while recruiting 45th on average. Talent helps. A great idea helps too.
Was this only a Big 12 story? The follow-up, "The Big 12's Power Shift Was Bigger Than the Big 12," zooms out to the whole country, all the way back to 1965.
Data: every FBS score, SP+ ratings, final AP polls, recruiting rankings and 2004–2010 team season stats from CollegeFootballData.com; 1996–2003 team season stats from Sports-Reference. The Sports-Reference numbers match every team's record and, for 92 of 96 team-seasons, its points exactly. Title games aren't counted in the North–South records.