Build Your Own Rankings
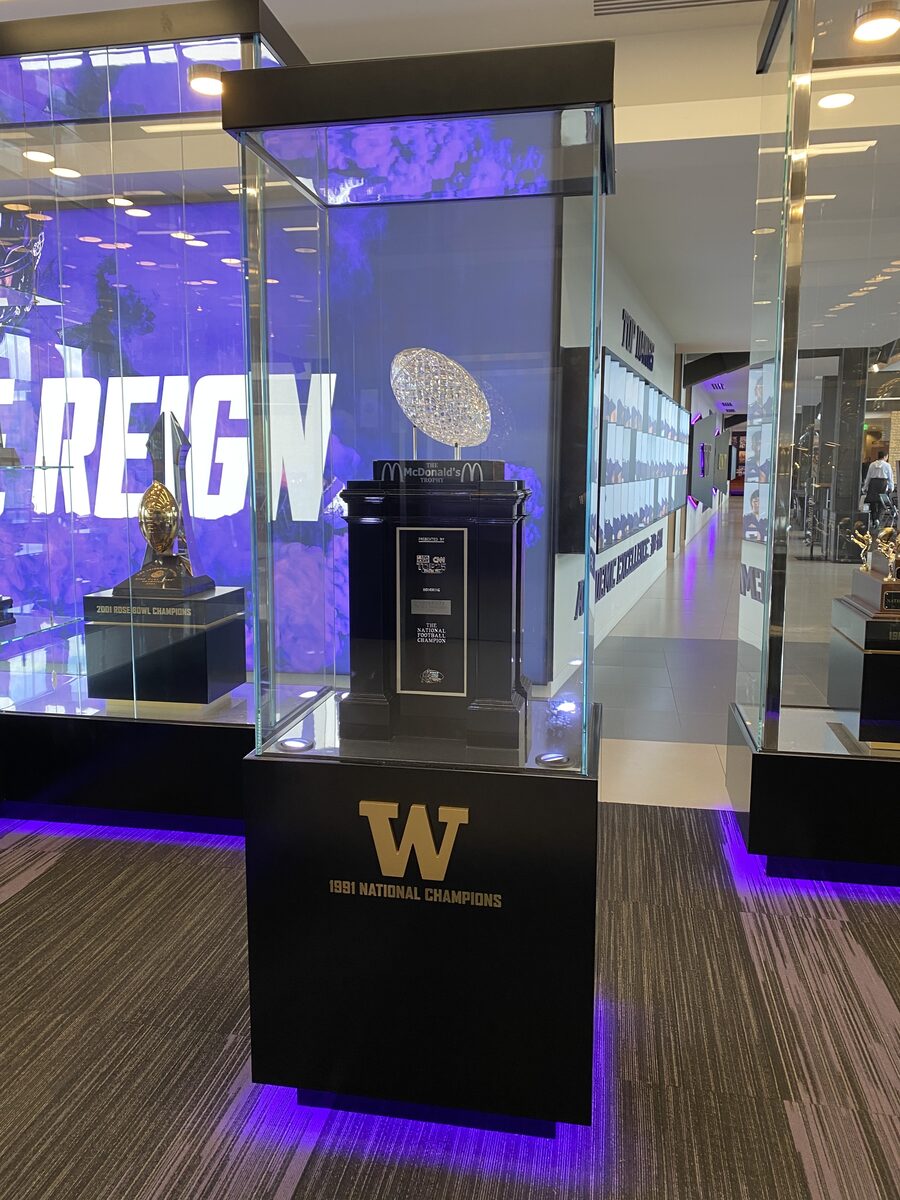
In 1991, Miami and Washington both finished 12–0. The AP poll said Miami was No. 1. The coaches said Washington. Same season, same games, two different champions, and the coaches even handed Washington a crystal football to prove it. Rankings disagree because they measure different things. So we built a page where you can line up as many of them as you want and see for yourself.

How it works
- One, Two or Custom. One list, two side by side, or Custom, where you can stack up to eight.
- Click any list's name to swap it. Lists come in seven groups (polls, weather, offense, defense, strength, betting and the most extreme kickoffs), and you can just type what you want: “wind,” “turnovers,” “over.”
- Season or All-time on each list. All-time means every season a team played in the top division since 2005.
- Top 5 to 50. In Custom, one slider sets how many teams every list shows.
- Conference. Show only the SEC, only the Power 4, only the Group of 6, and so on. Team lists re-rank inside the conference, and hovering a team shows where it ranks nationally.
- Pin a team. Hover a team and it lights up in every list. Click it (or type its name at the top) and it stays lit, and every list shows where it ranks even if it's nowhere near the top.
- Copy link saves the whole setup, so you can send your exact lineup to the group chat.
Pin a team, see its whole personality
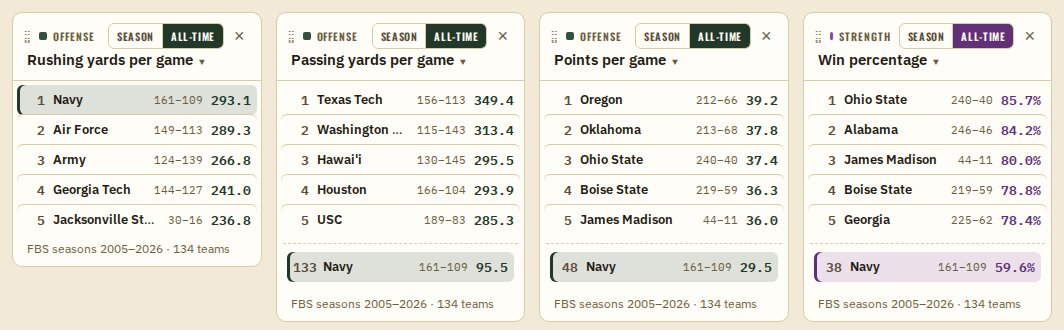
Here's Navy pinned across four all-time lists. In one glance you get the whole story of the Midshipmen's offense: first in the country in rushing at 293.1 yards a game, and 133rd of 134 in passing at 95.5. (The only team that throws less? Army, at 87.7. Of course.)
Now the twist. After our post on what happens when academies collide, you might guess Navy games are just low-scoring, period. Nope. Since 2017, when we start having betting lines, Navy games went over the posted total 59 times and under 54 times (plus one push). That puts Navy 99th of 133 in how often its games stay under. The points only vanish when Navy plays another academy. Against everybody else, the option is somebody else's problem.
Five things we found poking around
All-time numbers here cover every top-division season since 2005, for teams with at least 40 games.
- Clemson is basically waterproof. In games with measurable rain or snow, Clemson is 18–1. That's a 95% win rate, the best of any team with at least 10 wet games. Ohio State is next at 27–2 (93%), then Alabama at 17–2 (89%). Turns out good teams are also good when it's wet. Who knew.
- The ground belongs to the academies. Navy (293.1 rushing yards a game), Air Force (289.3) and Army (266.8) go 1, 2, 3. The air belongs to Texas Tech, at 349.4 passing yards a game.
- The usual suspects run the big lists. Oregon scores the most, 39.2 points a game. Alabama allows the fewest, 15.9. Ohio State has the best record, 240–40 (85.7%), just ahead of Alabama's 246–46 (84.2%).
- Bring a coat to Minnesota. Minnesota's games have the coldest average kickoff, 56.6°F, edging Michigan State's 56.7°F. Bring sunscreen to South Florida: Florida Atlantic and Florida International tie for the warmest at 74.2°F.
- The betting lists (adults only). USC games go over the posted total 59.3% of the time, the most of anyone. San Diego State games stay under the most: 42 overs, 69 unders. And against the spread, James Madison covers 63.6% of the time, though it's only played in the top division since 2022, so that's a small sample. Notre Dame is right behind at 63.0% (75–44–2) over every season since 2017. As always: betting is for adults, and the house usually wins. We just keep score.
Over rate and cover rate
Before every game, sportsbooks post a total (how many points both teams will score together) and a spread (how many points one team should win by). Over rate is how often a team's games beat the total. Cover rate is how often the team beat the spread. A team can lose a game and still cover, if it lost by less than the spread said. Pushes (exact ties with the line) are left out.
Filter by conference
Switch the filter to the Group of 6 and this season's scoring list has James Madison on top at 44.8 points a game. Hover it and you'll see it's 7th nationally, behind six power-conference teams led by Georgia's 54.8 (numbers through the games of Sept. 27; the season lists update every week). Polls keep their real numbers when you filter, so the SEC's slice of the AP poll might read 1, 2, 7, 8, 9…
The fine print
- 40 games to make an all-time list. That's about three seasons. Without it, a team that just moved up a division could top a list off a handful of games.
- Betting lists start in 2017. That's when real sportsbook lines start in our data.
- Conferences are this season's. So when you filter to the SEC, Oklahoma brings its Big 12 years along with it.
- Ties share a rank, the way golf does it: 1, 2, 2, 4.
- Records on the kickoff lists are each team's record going into that game, which matches the AP rank shown next to it.
A confession or two
Building this turned up two mistakes. First, our database was missing the betting lines for every game from 2026's first two weeks. They're back now. Our weekly recaps weren't affected, because each recap grades the model against the line it saved with its prediction before kickoff, not the database copy. Second, the first version of the page forgot to apply the 40-game rule to the betting lists, so Kennesaw State, a top-division team only since 2024, briefly sat at No. 1 all-time in how often its games go under. Fixed. Sorry, Owls.
Oh, and the new look
You might've noticed the site's header got a little more football-y: pebbled leather, with laces. If your phone or computer is in dark mode, the rest of the page turned navy, too. It's still the same old numbers underneath.
Data: games, box scores, polls, betting lines (from 2017) and SP+ via
CollegeFootballData.com; weather via Visual Crossing. All-time lists
cover every top-division season since 2005. The numbers in this post
come from rankings_page_tour.ipynb in the project, run on
the data behind the Rankings page as of Oct. 2, 2026.