
When Academies Collide
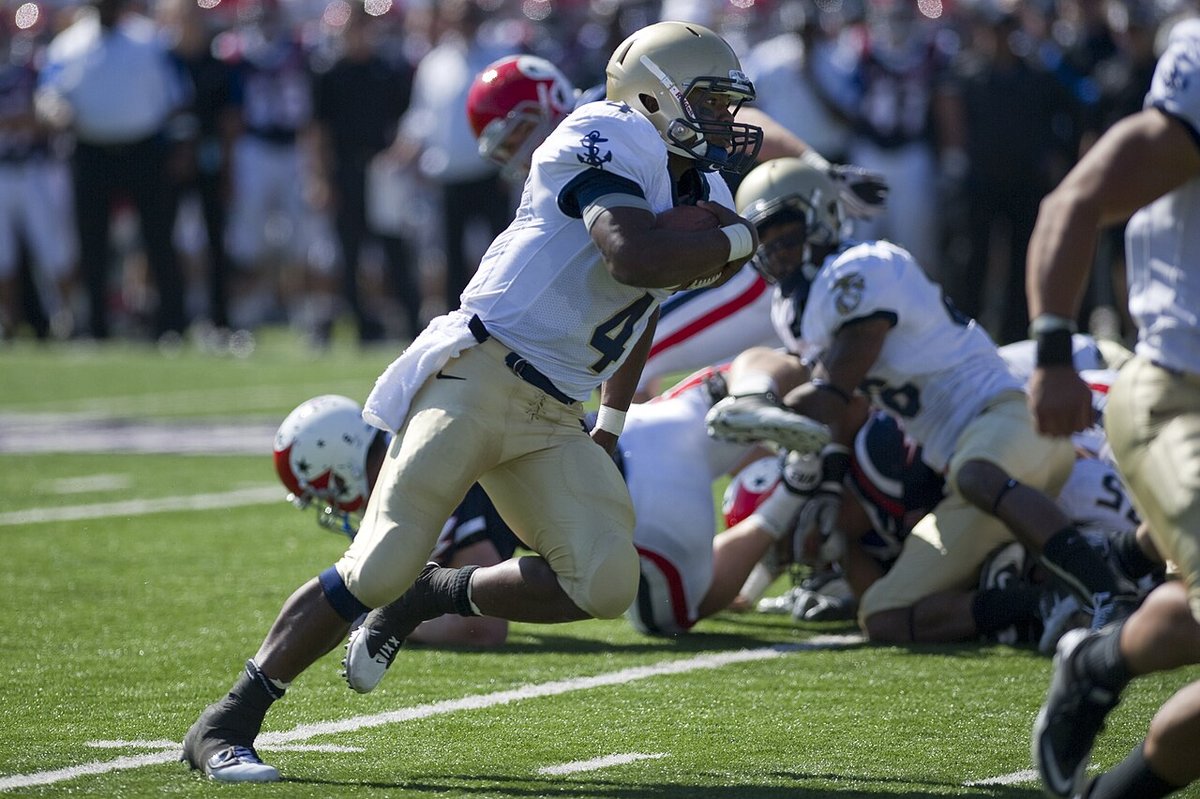
This week our model looked at Navy at Air Force and said 57.1 points. The sportsbooks said 45.5. That's not a small disagreement, that's two totally different football games. So which one was crazy? Spoiler: it was us. And the reason turned out to be one of the coolest little quirks in college football: when two service academies play each other, the points just… disappear.

The model's academy problem
Our model predicts a game's total by adding up how good each team's offense and defense are. That works fine most of the time. But it has no idea how a team plays, only how many points it tends to score and give up. Normally that's fine. For academy-vs-academy games, it's a disaster.
We checked all 47 games between two academies from 2010 to 2025. The average total was just 38.3 points, and 87% of them came in under the model's prediction. Here's every one of those games, by how far off the model was:
Each dot is one game; the black line is each pairing's average. The gray dot on the far right is Air Force at Navy in 2017, a 48–45 shootout with 93 points. Every game is predicted using only seasons before it, the way the model actually works. Hover a dot for the game.
See all those dots on the left? The model was too high on these games by around 20 points in the Army matchups. And since posted totals started showing up in our data in 2017, its over/under calls on these games went 6–20. Yikes.
Why it happens (it's not the clock)
Our first guess was the clock. Option teams run the ball, running plays keep the clock moving, so two option teams should get fewer possessions. Makes sense, right? Except the data said nope.
Drives and points per drive
A drive is one possession, from when a team gets the ball to when it scores, punts or turns it over. A team's points come from two things: how many drives it gets, and how many points it scores per drive on average.
Points per drive here is the team's final score divided by its drives, so it includes the occasional defensive or special-teams touchdown.
Academy offenses get basically the same number of drives against each other (10.80 a game) as against everybody else (10.94). What changes is what they do with them: 1.78 points per drive against another academy, compared with 2.78 against everyone else. That's a full point less every time they touch the ball. Their drives are shorter, too: 5.60 plays instead of 6.24.
So here's the theory we like. The option is tricky to defend because it's weird. Most defenses see it once a year and spend a week cramming for it. But an academy defense practices against the option every single day, because its own offense runs it. When two academies meet, neither offense gets to be weird.
What we tried
First we tried teaching the model about style: how much each team ran the ball last season, and how many drives its games had. That barely helped. The academy games still came in 15.2 points under the model at best, and the over/under record didn't budge. There are only three of these games a season, too few for the model to learn about on its own.
What worked was simpler: look at how far off the model has been in past academy-vs-academy games, and subtract that from future ones. We tested it the honest way, predicting each season using only the seasons before it. From 2017 to 2025, the academy games went from 17.7 points under the model to 2.5, and the over/under calls went from 6–20 to 16–10. Every other game stays exactly the same.
Fair warning: 26 games is a small pile, so don't read too much into 16–10. The part we trust is that the model isn't way too high anymore.
Not all academy games are alike

Look back at the chart: Air Force vs. Navy sits noticeably closer to zero than the two Army matchups. Even the sportsbooks have been roughly right on that one. Here's each pairing:
| Pairing | Games | Avg. vs. model | Avg. vs. posted total | Model's cut |
|---|---|---|---|---|
| Army vs. Navy | 15 | −20.3 | −6.3 | −17.8 |
| Air Force vs. Army | 16 | −19.4 | −15.1 | −15.9 |
| Air Force vs. Navy | 16 | −11.3 | +2.7 | −12.1 |
Avg. vs. model: 2010–2025, before any cut. Avg. vs. posted total: 2017–2025, 9 games each. Model's cut: trained on every season through 2025.
So why not just give each pairing its own average? Because 16 games is a tiny sample. A single wild game, like that 93-pointer, can drag an average around a lot. Without it, Air Force–Navy finished 1.9 points under the posted total on average instead of 2.7 over.
Leaning on the group
The model splits the difference: each pairing gets its own cut, pulled toward the average of all academy games. The fewer games a pairing has, and the more the pairings look alike, the harder it gets pulled. It's like guessing a new player's free-throw percentage: after 10 shots you don't fully trust their 10 shots, so you lean on what most players shoot.
The first version of the fix used one cut for every academy game, and it cut Air Force–Navy games by about 7 points too much. Giving each pairing its own cut shrank that to about 4.
“But didn't they just score 65 last year?”
They did! Last year's Air Force at Navy game had 65 points, when the model said 60.3. So shouldn't the model lean toward points this year, especially since both head coaches are the same?
We checked every game since 2010 between two teams that also played the season before (6,362 of them). How much of last year's miss shows up again this year?
| Repeat matchups | Games | Last year's miss that carried over |
|---|---|---|
| All | 6,362 | 1.8% |
| Both head coaches the same | 4,099 | 2.9% |
| A head coach changed | 2,263 | −0.4% |
| Academy vs. academy, same coaches | 39 | 12.8% |
Almost nothing. Same coaches nudges it up a little, but a 2.9% carryover means a game that beat the model by 20 points last year is worth about half a point this year. The academy number looks bigger, but 39 games is way too few to tell it apart from zero. One game is mostly noise: a typical game lands 16.9 points away from the model either way, thanks to things like a pick-six, a couple of long runs or a wild fourth quarter. None of that repeats.
So what about Saturday?
With the academy cut, the model now says 45.0 for Navy at Air Force, and the posted total has drifted up to 46.5 (as of Thursday). So after all that, the model and the sportsbooks pretty much agree. We'll grade it in next week's recap. As always, none of this is betting advice: the house usually wins, and betting is for adults.
Data: final scores, drives and plays for every game with a
top-division team, 2010–2025, and posted totals from 2017, from
CollegeFootballData.com. Model predictions come from our totals model,
retrained season by season on earlier seasons only. Head coaches are
each team's coach at the start of the season. The full analysis,
including the style features that didn't help, is in
option_matchups.ipynb in the project.