
Which Coaches Win in Bad Weather?
Everything on this site so far has been about averages across all teams. Rain cuts passing yards without changing who wins, on average. But averages can hide people. Maybe some coaches really do get more out of their teams when the sky opens up. So we looked at every head coach since 2005: who's coached the most wet, windy and snowy games, who has the best record in them, and whether anyone's teams beat their own expectations in bad weather by more than luck would explain.
Quick definitions. A wet game had any measurable rain in the four hours after kickoff (same rule as the dashboard's "Wet" badge). A windy game had steady wind of 15 mph or more. Snowy means any snow at all. Only outdoor games count, from 2005 through week 3 of 2026, and each game goes to whoever was head coach that day, so when a coach is fired mid-season, each coach gets credit only for their own games.
Who has coached the most bad-weather games
| Coach | Teams | Wet games | Record |
|---|---|---|---|
| Brian Kelly | Notre Dame, Cincinnati, Central Michigan | 33 | 23–10 |
| Kyle Whittingham | Utah | 31 | 21–10 |
| Pat Fitzgerald | Northwestern | 31 | 19–12 |
| P.J. Fleck | Minnesota, Western Michigan | 28 | 14–14 |
| Kirk Ferentz | Iowa | 27 | 17–10 |
| Coach | Teams | Windy games | Record |
|---|---|---|---|
| Troy Calhoun | Air Force | 66 | 39–27 |
| Kirk Ferentz | Iowa | 63 | 40–23 |
| Kyle Whittingham | Utah | 50 | 32–18 |
| Mark Dantonio | Michigan State, Cincinnati | 50 | 31–19 |
| Gary Patterson | TCU | 49 | 35–14 |
No shock on the wind list: Air Force, Iowa and Utah play in some of the windiest stadiums in the sport, and coaches who stay a long time rack up the games.
Great records mostly mean great teams
Among coaches with at least 15 wet games, the best records belong to Urban Meyer and Dabo Swinney, both 16–1, followed by Art Briles (13–3), Gary Patterson (16–4) and Dan Mullen (12–3). In the wind (at least 25 games), it's Bob Stoops at 31–6, then Matt Campbell (35–9), Jerry Kill (22–6) and Mike Leach (25–7).
So how do you tell a rain wizard from a great team?
For every game, we figured out how much each team should have won or lost by, based on how good both teams were (their SP+ ratings) plus home field. Then we compared how far a coach's teams beat that number in bad weather with how far they beat it in normal weather. A great team that's equally great in the rain gets no weather credit.
By that measure, Meyer's and Swinney's teams were only a point or two better in the rain than they already were, and Stoops's teams were actually a tiny bit worse than expected in the wind. Great records, no weather superpower.
Two coaches who beat their own expectations in the rain
Once team strength is taken out, two names stand way apart from everybody else:


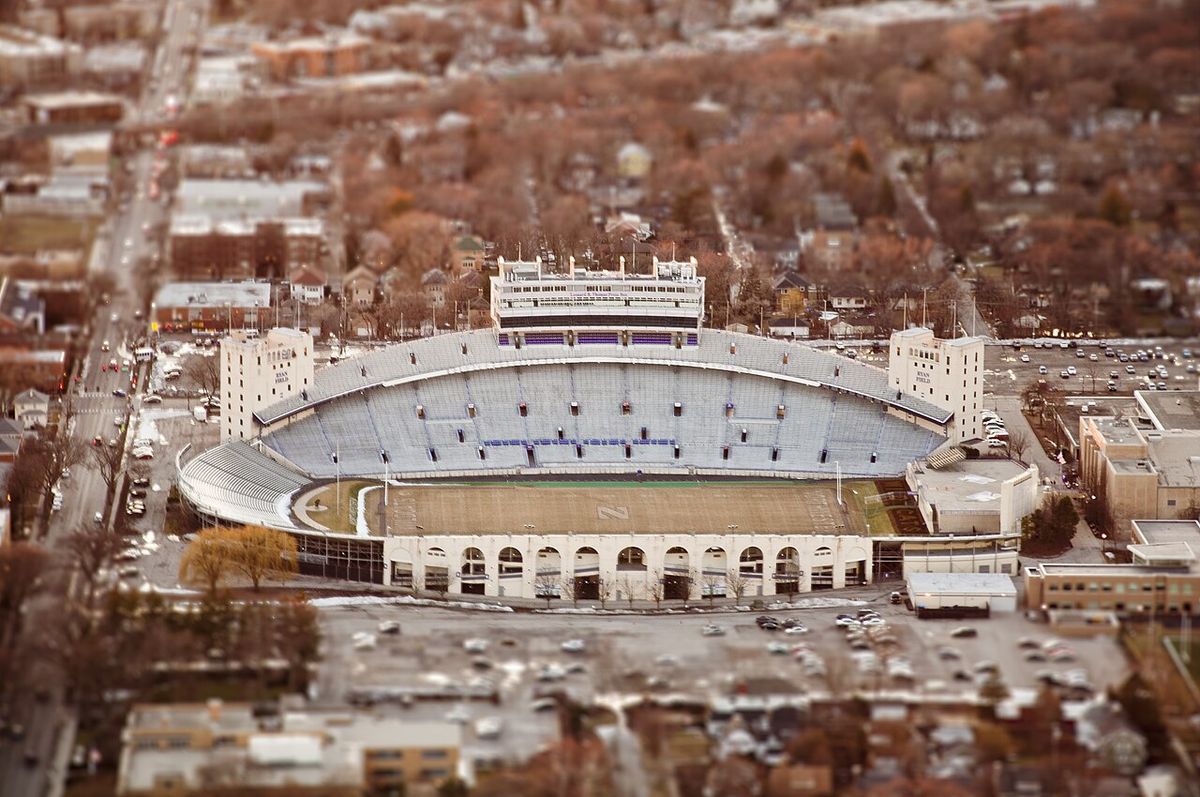
Pat Fitzgerald's Northwestern teams went 19–12 in wet games, compared with a .519 winning percentage in normal weather, and beat their expectation by about 10 points in the rain versus 1 point otherwise. Ken Niumatalolo's teams at Navy and San José State did almost exactly the same thing: 12–7, about 11 points above expectation in the wet versus 2 in normal weather. Niumatalolo's case has an obvious explanation: his triple-option offenses barely threw the ball, and rain's biggest effect in the broader research is on passing. You can't lose a passing game you never planned to play.
A result like this can come from a few flukes, so we poked at it:
- Not home field. Fitzgerald's edge holds at home (+8.9 vs. +0.0 normally) and on the road (+11.5 vs. +2.5). Niumatalolo's is strongest on the road.
- Not a couple of great seasons. Measured against each season's own average, both stay about 7 points better in the rain, spread across 15 seasons for Fitzgerald and 14 for Niumatalolo.
- Not a couple of blowouts. Fitzgerald's teams beat expectation in 23 of 28 wet games, Niumatalolo's in 15 of 19, and tossing out each coach's two best and two worst games barely moves the number.

Why it isn't proof: we tested 68 coaches with enough wet games, and when you test that many, a couple will look special just by luck. Think of it like 68 people each flipping a coin ten times: somebody is almost sure to get eight or more heads. After correcting for that, both coaches still clearly beat expectations in wet games, but the stricter claim, that they're better in the rain than in their own normal games, lands just short of the usual bar. A check against the sportsbooks' spreads (only available from 2017 on) points the same way for both, but it only covers 8 to 11 of their games. Strong candidates, not settled fact.
The wind: every "specialist" just has a windy stadium
Nothing in the wind survives the same test. The coaches who look best turn out to be enjoying home field, not the wind:
- Craig Bohl went 32–15 in windy games at Wyoming, compared with .397 otherwise. But 85% of his windy games were in Laramie, versus 31% of his normal-weather games. He went 31–9 in windy home games and 1–6 in windy road games. Measured against expectation, there's no wind effect at all. The wind wasn't his secret weapon. Home was.
- Matt Campbell went 35–9 in the wind at Iowa State and Toledo. His teams did beat expectations in windy home games (+7.0 vs. +1.6 normally), but on the road it's +1.7 vs. +1.1, basically nothing. His great windy road record came against weaker opponents than usual.
- Mike Gundy looks like a wind underperformer at 23–24, including 7–18 on windy road trips. But against the strength of his opponents, it's only a small dip that could easily be luck. Tougher opponents, not wind.
The other direction: Mike MacIntyre in the rain
One result does clear the bar, pointing the wrong way. Mike MacIntyre's teams at San José State, Colorado and FIU went 2–14 in wet games and beat their expectation in only 3 of them. Of the 9 with a betting line, his team fell short of the spread in all 9, by between 9.5 and 29.5 points. Part of that is just bad seasons: compared with each season's own average, the gap shrinks to about 7 points. And most of those games were light rain, not downpours. Still, 0 for 9 is hard to wave away.
Snow: eight games, no rankings
With the corrected weather data, only 8 games since 2005 had any snow falling during the game, and no coach has been in more than one. The winners: Blake Anderson (Utah State over New Mexico, 27–10), Andy Avalos (Boise State over Nevada, 41–3), Matt Campbell (Iowa State over Kansas State, 42–35), Nate Dreiling (Utah State over Hawai'i, 55–10), Lance Taylor (Western Michigan over Eastern Michigan, 26–18), Eli Drinkwitz (Missouri over Arkansas, 28–21), Greg Schiano (Rutgers over Michigan State, 41–14) and P.J. Fleck (Minnesota over Wisconsin, 17–7). Congrats, everybody. You're all tied for first.
One caveat on the yardstick: SP+ here is a full-season rating, so it already includes the games being judged. That makes the "better than expected" numbers a little smaller than they really are, but it doesn't affect the comparison between a coach's bad-weather and normal-weather games. For the wettest and windiest games themselves, see the wet and wind leaderboards.