
Sixty Years of Points
In 1965, a typical major college football team scored 16.6 points against another major college team. Somebody got shut out in 21% of those games. That's more than one game in five where a team walked off the field with a big fat zero. By 2016 the average was 29.0, and shutouts had become a novelty. So what happened in between? We went through 40,283 games to find out. Spoiler: football got way better at offense, and the rulebook kept helping. Mostly by messing with the clock.
Sixty-one seasons on one line
Here's every season since 1965: the average points one team scored in a game between two teams from the top division (what's now called FBS). The thin gray line is each season; the thick blue line smooths it out over five years so the big picture pops.
Hover a season for its number. The dotted lines are the three biggest clock-rule changes. On a phone, the chart scrolls sideways.
That's not a tug-of-war. That's a staircase going up, with a couple of stumbles. Let's walk it.
The eras

- 1965–67Two platoons are back. For the dozen years before 1965, college rules kept most players on the field for both offense and defense. In 1965 the NCAA brought back free substitution, so teams could have separate offensive and defensive units again. Scoring was still low, though: under 18 points per team-game every season from 1965 to 1967.
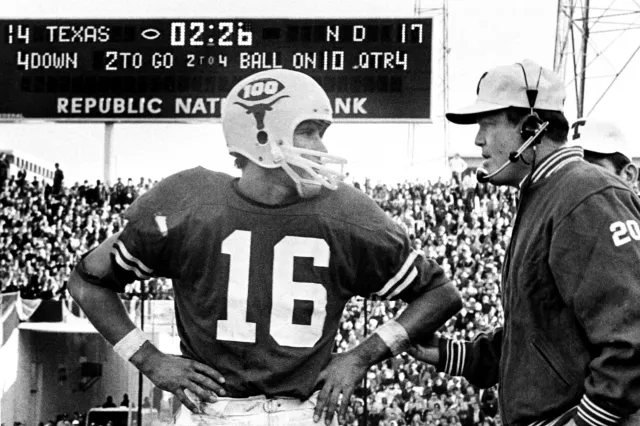
- 1968Stop the clock! In 1968, college football started stopping the clock after every first down. More clock stoppages means more plays, and more plays means more points. Scoring jumped 3.5 points per team in a single season, from 17.9 to 21.4, the biggest one-year rise in our data (other than one rebound from a failed rule, more on that below). That same fall, Texas rolled out a brand-new offense called the wishbone.
- 1970sThe option plateau. The wishbone and other option offenses took over, and teams ran, and ran, and ran. Scoring barely budged for a decade: 20.5 points per team-game on average. Shutouts dropped to about one game in nine (11% in 1975).
- 1980s–2000sThe passing climb. Offenses spread out and started throwing a lot more. Think BYU's air show in the '80s, the run-and-shoot, then Mike Leach's air raid. Scoring climbed every decade: 22.2 points per team-game in the 1980s, 24.6 in the 1990s, 26.2 in the 2000s.
- 2006–08The clock experiments. In 2006, the NCAA tried to shorten games by starting the clock sooner on kickoffs and changes of possession. In games between two power-conference teams, each team ran 64.7 plays, down from 71.0 the year before, and scoring across FBS fell from 26.3 to 23.6. Nobody liked it. The rule got tossed after one season, and scoring bounced right back to 27.8 in 2007. In 2008 came a gentler version, including a 40-second play clock, and plays per team in those games fell from 74.7 to 68.2.
- 2010sPeak points. Up-tempo offenses snapped the ball as fast as humanly possible, and the spread was everywhere. The 2010s averaged 28.1 points per team-game, and 2016 set the all-time high at 29.0. (The real story is a little twistier. See the tempo update.)
- 2017–nowThe slide. Points have drifted down since, to 26.2 in 2025. In 2023, the NCAA stopped stopping the clock after first downs (except in the last two minutes of each half), mostly undoing that 1968 rule. Which brings us to the question everyone's asking right now…

Are defenses finally winning?
Watch enough Saturday football lately and you'll hear it: defenses are getting better. Scores are lower. And it's true that scores are lower! But “points per game” is a sneaky stat.
Why points per game can fool you
A team's points in a game come from two things: how many chances it gets (drives) and how much it scores on each one (points per drive). If the clock runs faster and you get one fewer drive, you score fewer points even if your offense is exactly as good. It's like judging a basketball shooter by total points when they played half the minutes.
So we pulled every drive from every major college game since 2005: 433,569 of them. Here's what happened in games between two power-conference (P4) teams, split into those two pieces:
Points per game = Drives per game × Points per drive
The shaded area is the NIL era (2021 on). Hover any season for its number. Drives that start in the last minute of a half don't count toward points per drive, since nobody's really trying to score on those.
Scoring per game is down 4.6% compared with 2015–19. But drives per game are down even more, 8.7%. Teams went from about 13.3 drives a game in 2016 to 11.3 in 2025: fewer, longer drives, and the 2023 clock rule knocked off a couple more plays per team (70.4 to 68.2). And when P4 offenses do get the ball, they're scoring 5.1% more per drive than before, 2.23 points instead of 2.12. Yards per play? Basically identical (5.58 then, 5.56 now).
Smaller conferences (G5) show the same pattern: fewer drives, and points per drive holding steady at 2.22 to 2.23. So the drop in scoring is about the clock and the pace of the game, not defenses suddenly getting nasty.

The real change: the rich got richer
There's one catch in games between two P4 teams: if one side got better, you can't tell whether it was the offense or the defense, because every drive has both. But in a game between a P4 team and a G5 team, you can watch each unit against the other. So we compared P4 offenses against G5 defenses, and G5 offenses against P4 defenses, each measured against what G5 teams do to each other. We only used teams that stayed in the same group every season from 2015 to 2025, so conference shuffling can't fake a trend.
Adjusted for the strength of every opponent and for home field. The 2020 dip is the COVID season, when schedules were mostly conference games, so there were very few P4-vs-G5 games to measure.
That's the NIL era's real fingerprint. Since 2022, P4 offenses have done a lot more damage against G5 defenses than they used to: 0.73 extra points per drive on average, up from 0.50 in 2015–19. P4 defenses followed in 2024, when their edge over G5 offenses hit 0.78, the biggest in our data. That fits what you'd expect when the best G5 players can transfer up to bigger programs without sitting out a year, which has been the rule since 2021.
So if P4 defenses look scarier on Saturdays, part of it is who they're playing: G5 offenses whose best players just moved up. And notice it's both sides of the ball. The offenses actually moved first.
Does talent matter more on defense now?
Here's a smart theory: maybe a star pass rusher can wreck a game by himself, while a great offense needs eleven guys in sync. If so, now that it's easier to stack a roster, talent should pay off more on defense than on offense. We checked using a measure of each P4 roster's talent (from recruiting ratings, including transfers).
| Extra points per drive from more talent | 2015–20 | 2021–25 |
|---|---|---|
| Offense (points scored) | 0.26 | 0.26 |
| Defense (points prevented) | 0.23 | 0.21 |
Nope, not so far. A noticeably more talented roster (one “standard deviation” above average, in stats-speak) is worth about a quarter of a point per drive on both sides of the ball, before and after 2021. Single seasons bounce around: in 2025, talent lined up with defense much better than with offense, but in 2022 it was the other way around. So the theory isn't dead. We'll check again after this season.
So is it a tug-of-war?
The classic story goes like this: offense invents something, defense figures it out, offense invents something else. That probably does happen with individual schemes. Defenses eventually learned to handle the wishbone, and they're always chasing the newest spread trick. But across the whole sport, 60 years of scores look less like a tug-of-war and more like offense winning, slowly, almost every decade. Most of the big moves in either direction line up with the rulebook: 1968, 2006, 2008 and 2023 were all about the clock. To catch a real back-and-forth between schemes, we'd need play-by-play data labeled by formation, which we don't have (yet).
One more thing: 2026 isn't in any of these numbers. It's only a few weeks old, and early-season games are full of mismatches. Check back after bowl season.
Update, Oct. 12: the tempo bubble
A question came in after this went up: didn't the NCAA crack down on hurry-up offenses in 2014? And could that explain the 2016 peak, if coaches took a couple of years to adjust?
Here's what we found about 2014. The NCAA rules committee proposed what everyone called the “10-second rule.” Offenses couldn't snap the ball until the 40-second play clock got down to 29, so defenses would always have time to swap players. Snap too early? Five-yard penalty. Hurry-up coaches hated it, and most coaches said they were against it. In March the committee shelved it, so it never took effect.
So there was no crackdown in 2014. But the thing you might remember, an official standing over the ball while the defense swaps players, is real. It just came earlier, and in steps. The rule itself (when the offense substitutes, the defense gets a chance to match) had been around for years, but crews enforced it unevenly. In June 2011, the national officiating office sent every crew a memo making it mandatory: when the offense subs, the referee sticks his arms out, the umpire stands over the ball, and nobody snaps until the referee waves him off. Then the Big 12 added an eighth official in 2013, and every conference could from 2015. The NCAA rulebook says that extra official made the substitution process more consistent.
The question underneath is still a great one, though: when did offenses actually go fastest? Here's pace (plays per team, per game) in every game between two FBS teams since 2005, next to how many points offenses scored per play:
The shaded years are 2012–2016, and the dot marks 2016. Hover any season for its number. Points per play starts in 2014, like the drive numbers above.
Three things jump out:
- The hurry-up boom hit in 2012. Plays per team jumped from 70.4 to 72.2 in one season, and the fastest tenth of offenses went from 77.1 plays a game to 80.6. Then pace sat on a plateau through 2016.
- 2016 wasn't the fastest year. It was the best year per play. Pace in 2016 (72.6) was already a hair slower than 2014 (73.0). What set the record was efficiency: 38.0 points per 100 plays, up from 36.8 in 2014, and 5.65 yards per play, up from 5.53.
- Then the bubble slowly leaked. Plays per team slid to 71.2 in 2017, 70.5 in 2019 and 67.8 in 2025 (the 2023 clock rule took a bite too). But points per play kept climbing until 2020, to 39.1. Offenses got slower and better per snap at the same time.
Fun fact: the fastest season in our data isn't from the hurry-up era at all. It's 2007, at 75.0 plays per team, the one year between the failed 2006 clock rule and the 40-second play clock.
So did any of those steps slow the hurry-up teams down? Plays per game can't really answer that, because a team that keeps getting first downs runs more plays even at a normal speed. So we timed offenses instead: how many seconds of game clock each one used per play, counting only drives in the first three quarters with the score within 14 (so nobody's killing the clock or racing a comeback). The clock data holds up from 2008, when the 40-second play clock arrived, through 2018. Lower is faster, and under Baylor's number is where the Bears ranked among all FBS offenses:
| Season | Average | Fastest 5 | Baylor |
|---|---|---|---|
| 2010 | 26.1 | 19.9 | 25.755th |
| 2011the officials' memo | 25.7 | 19.7 | 21.29th |
| 2012 | 25.0 | 18.4 | 18.63rd |
| 2013Big 12 adds an 8th official | 24.7 | 18.5 | 18.11st |
| 20158th official for everyone | 24.9 | 19.2 | 18.51st |
| 2016 | 24.8 | 19.1 | 18.42nd |
| 2017Baylor's new coaches | 25.4 | 20.2 | 25.265th |
- Everybody kept speeding up right through the memo. The average team went from 26.6 seconds per play in 2008 to 24.7 in 2013, and the fastest five got quicker too. Every season, the fastest five ran 5.3 to 6.6 seconds per play faster than average, and that gap never closed in 2011, 2013 or 2015.
- Baylor didn't even notice. The Bears were the fastest offense in the country in 2013 and 2015, the exact seasons the extra official showed up, first in the Big 12 and then everywhere. From 2012 through 2016 they ran 5.9 to 6.6 seconds per play faster than the average team. Baylor finally slowed down in 2017, with new coaches, not new rules.
- Why didn't the crackdown bite? Our guess: the rule only kicks in when the offense substitutes. Keep the same 11 guys on the field and you can still snap as fast as you like. Our data can't see substitutions, though, so we can't prove that.
So the lag theory doesn't get much support. The hurry-up era kept spreading through every enforcement step. Pace did start sliding after 2016, and a second count of plays, from play-by-play data, shows a slow slide, not a sudden stop. Defenses figuring out the spread, coaches cooling on tempo, the fastest programs changing hands, or plain old fashion could all be behind it, and season averages can't tell them apart.
Data: final scores for every game between two top-division teams, 1965–2025, and every drive of every FBS game from 2005 on (17,131 games), from CollegeFootballData.com; roster talent from the 247Sports team talent composite. Points per drive count offensive touchdowns as 7 and field goals as 3. The drive feed labels results differently before 2014, so all the drive comparisons here use 2014 on. P4 means that season's power conferences plus Notre Dame. Rule history: free substitution, the wishbone, the 2006 clock rule, 2008's 40-second clock and the 2023 clock rule. The tempo update uses the same drive data, in games between two FBS teams; the fastest tenth is the 90th percentile of teams' average plays per game (teams with six or more of those games). The second count of plays is CFBD's season advanced stats, compared from 2014 on. Seconds per play use the drive feed's clock times, 2008–2018, only in games whose drives add up to about 60 minutes (the feed's clock data gets patchy after 2018), for teams with six or more of those games.