
Over, Under, or Overthinking?
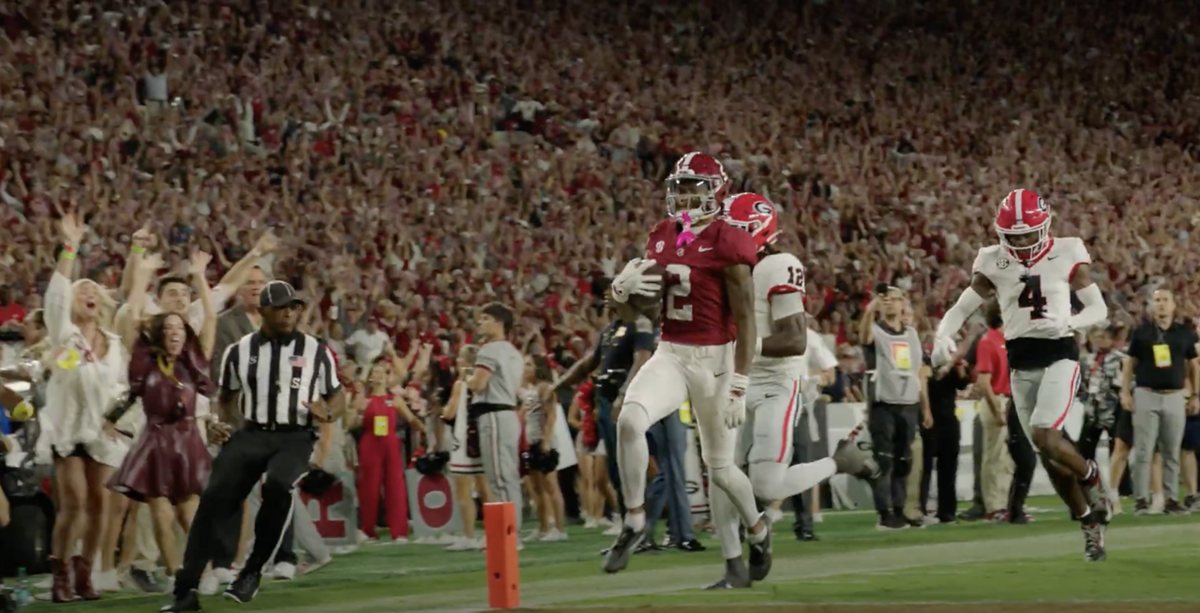
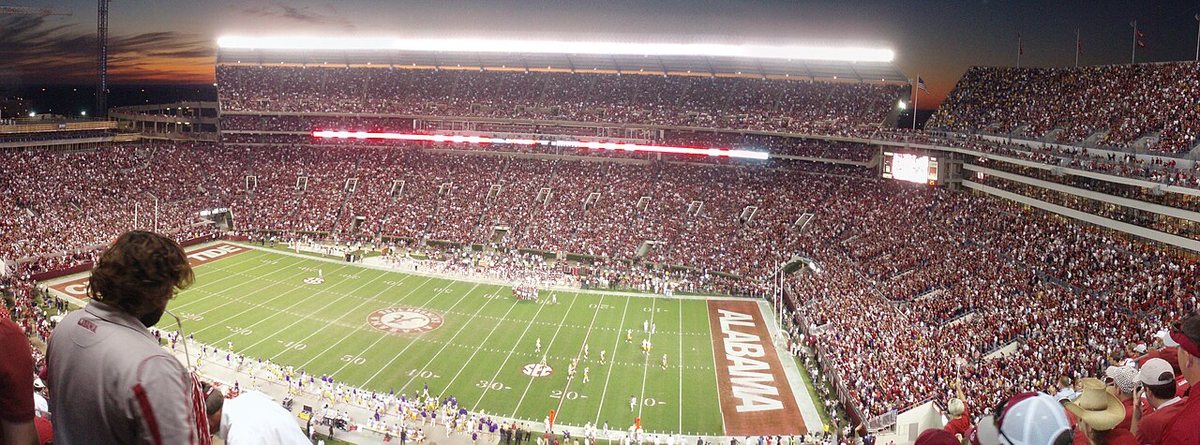
Saturday night in Tuscaloosa: #2 Georgia at #6 Alabama, 6:30 Central on ABC. The sportsbooks set the over/under at 51.5 points. Our totals model looked at the same game and said 63.7. That's a 12.2-point argument, the third-biggest gap on our board this week, between a computer and a lot of people with money on the line. So we did what any reasonable football nerd would do: we dug through every trend we could find, lowered our standards on purpose, and asked whether any of it changes the most likely outcome.

Over/under, in 20 seconds
Sportsbooks post a number for the total points both teams will score combined. If the real total is higher, the game went over; lower, under. The number is set so roughly half of games land on each side, which makes it a pretty good guess at the middle outcome. (Betting is for adults, and the house usually wins. We're here for the math.)
Why our model is so excited
Look at these two offenses. Georgia scores 51.4 points a game, the most in the country. Alabama scores 49.6, second-most. Our model builds each team's rating from this season's games plus last season's, so two offenses lighting up scoreboards every week push its number way up.
The defenses aren't equal, either. Georgia allows 13.4 points a game (12th-fewest in the country). Alabama allows 20.8 (51st). And the weather's no help to the under: the latest forecast says a sprinkle at most (0.02 inches) and 10 mph wind, which only knocks 0.4 points off the model's number.
The sportsbooks see the same offenses and still say 51.5. With Alabama favored by 2.5, that works out to roughly Alabama 27, Georgia 24.5. Somebody's going to be very wrong.
Ten for ten
Here's the wild part. Both teams have gone over the total in every single game this season. Five for five, each. Georgia's games have beaten the line by 13.1 points on average, and Alabama's by 17.3.
Georgia
| Wk | Game | Total | Line | +/− |
|---|---|---|---|---|
| 1 | vs. Tennessee State, 63–3 | 66 | 55.5 | +10.5 |
| 2 | vs. Western Kentucky, 70–20 | 90 | 55.5 | +34.5 |
| 3 | at Arkansas, 45–17 | 62 | 54.5 | +7.5 |
| 4 | vs. Oklahoma, 41–13 | 54 | 43.5 | +10.5 |
| 5 | vs. Vanderbilt, 38–14 | 52 | 49.5 | +2.5 |
Alabama
| Wk | Game | Total | Line | +/− |
|---|---|---|---|---|
| 1 | vs. East Carolina, 48–10 | 58 | 52.5 | +5.5 |
| 2 | at Kentucky, 45–17 | 62 | 47.5 | +14.5 |
| 3 | vs. Florida State, 50–36 | 86 | 49.5 | +36.5 |
| 4 | vs. South Carolina, 49–18 | 67 | 53.5 | +13.5 |
| 5 | at Mississippi State, 56–23 | 79 | 62.5 | +16.5 |
Notice something? All ten were double-digit wins, which is a great way to pile up points. Saturday's opponent is a different story. And we checked every game from 2017 through 2025: there wasn't a single one where both teams came in perfect to the over after four or more games. So this is brand-new territory for our data.
Does the model's big number mean anything?
Here's the gut check. We re-ran our model on every season from 2017 to 2025, each season predicted using only the seasons before it, so it never got to peek at the answers. Then we asked: when the model was way above the posted total, how often did the game actually go over?
| When our model was… | Games | Model's side won |
|---|---|---|
| Every game | 7,133 | 50.8% |
| 10+ points above the line | 165 | 50.9% |
| 8+ above, with a line from 45.5 to 52 | 185 | 47.0% |
| 6+ above, both teams ranked | 38 | 42.1% |
A coin flip, basically. A bigger disagreement doesn't make the model more right. Part of the reason: our model aims at the average total, and every so often a 90-point shootout drags the average up. The sportsbooks aim at the middle game. So our model leans toward the over most weeks anyway, and leans hardest on exactly this kind of game: two offenses fresh off a few blowouts.
Do over streaks keep going?
This is the trend that got our attention. Once a team has played at least four games, does its over/under record so far tell you anything about its next game?
Every team-game from 2017 to 2025 with a posted total, once the team had played at least four games with a line. Each dot is how often the team's next game went over. Hover a dot for the details.
Teams that had gone over in more than three-quarters of their games went over in their next one only 44.2% of the time (511 games). That's more than two "standard errors" away from a coin flip, which is statistics talk for "probably not just luck, but don't bet the house on it."
It gets stronger when both teams are hot:
- When both teams had gone over in at least 75% of their games, the game went over 44.6% of the time (65 games), and landed 3.1 points under the line on average.
- When both teams had been beating their totals by 8 or more points a game, like Georgia (13.1) and Alabama (17.3) this year, the game went over just 36.7% of the time (30 games).
Why would a hot streak cool off?
Two reasons, probably working together. First, sportsbooks notice. After a team blows past the total a few times, its next totals get set higher, and maybe a little too high. Second, early-season blowouts are partly luck: a pick-six here, a busted coverage there. That luck doesn't follow a team from week to week, so its scoring tends to drift back toward normal. Statisticians call that “regression to the mean.”
But these offenses are real
Before you lock in the under, one trend pushes back. When both teams came in averaging 40 or more points a game, the game went over 56.9% of the time (51 games), by almost 3 points on average. Great offenses scoring a lot isn't exactly a shocking idea. And Georgia and Alabama are both well over 40.
What about the idea that big games turn into defensive slugfests? Not in our data. When two top-10 teams met, the game went over 53.7% of the time (82 games), and landed almost exactly on the line on average. Big games are just games.
The rivalry so far
Georgia and Alabama have met nine times since January 2018 with a posted total, including two national title games and four SEC title games. The over/under record: 4 overs, 4 unders and 1 push. A perfect tie, naturally.
| Date | Game | Where | Total | Line | Result |
|---|---|---|---|---|---|
| Jan 8, 2018 | Alabama 26, Georgia 23 · National title game | Atlanta | 49 | 45.5 | Over |
| Dec 1, 2018 | Alabama 35, Georgia 28 · SEC title game | Atlanta | 63 | 63 | Push |
| Oct 17, 2020 | Alabama 41, Georgia 24 · Regular season | Tuscaloosa | 65 | 57 | Over |
| Dec 4, 2021 | Alabama 41, Georgia 24 · SEC title game | Atlanta | 65 | 49 | Over |
| Jan 10, 2022 | Georgia 33, Alabama 18 · National title game | Indianapolis | 51 | 53 | Under |
| Dec 2, 2023 | Alabama 27, Georgia 24 · SEC title game | Atlanta | 51 | 52.5 | Under |
| Sep 28, 2024 | Alabama 41, Georgia 34 · Regular season | Tuscaloosa | 75 | 64.5 | Over |
| Sep 27, 2025 | Alabama 24, Georgia 21 · Regular season | Athens | 45 | 52.5 | Under |
| Dec 6, 2025 | Georgia 28, Alabama 7 · SEC title game | Atlanta | 35 | 47.5 | Under |
The total has averaged 55.4 against an average line of 53.8, so these games have run a hair hot. In Tuscaloosa specifically, the last two were shootouts: 65 points in 2020 and 75 in 2024. But last season's two meetings were the two lowest-scoring games on the list: 45 points in September and 35 in the SEC title game.

Update, Friday: we turned the hunch into a test
After this post went up, we tested the cool-off idea properly. The question: if you shade our model's prediction by how far each team's games have been beating (or missing) the posted total, does the model get better? We picked the size of the shade using 2017–2020 only, then checked it on 2021–2025. The model's record against the line went from 51.26% to 52.31%, and the picks the shade flipped went 157–112.
Promising, but there's a catch: we got the idea by looking at those same seasons. The only honest test is games that haven't been played yet. So starting this week, our model quietly works out a second “shadow” number for every game, and each weekly recap grades it. It doesn't change any picks on the dashboard.
For this game, Georgia's games have beaten the line by 13.1 points on average and Alabama's by 17.3. The shade takes 0.1208 points off for every one of those, which comes to 3.7 points here. The model itself moved too: with the forecast back up to a tenth of an inch of rain, it says 62.4 as of Friday afternoon. The shadow says 58.7.
So even the cooled-off number is 7.2 points above the posted 51.5. The shadow still says over, just less loudly. The shade is deliberately small: on its own it can't drag a gap this big below the line. Our slight lean to the under still rests on the bigger patterns above, with all their small-sample caveats.
So what's our call?
Adding it all up:
- The model says over, big. But its big gaps have been coin flips, and its gaps with two ranked teams have leaned the wrong way.
- The streaks say under. This is the strongest trend we found, with the most games behind it.
- The offenses say over, a little. Two 40-point offenses have tended to push games past the total.
- The rivalry says shrug. 4–4–1.
Our honest best guess for the most likely outcome: a total right around the posted 51.5, maybe a little under. Something like Alabama 27, Georgia 24 wouldn't surprise anybody. The model's 63.7 looks like what happens when two great offenses' early-season numbers, built mostly against weaker teams, run into two defenses the sportsbooks clearly respect.
One more honest note. We tried a bunch of trends and told you about the interesting ones. Try enough trends and a couple will look meaningful by pure luck, and most of these groups are small. That's why we're calling it a lean, not a lock. We'll check back after the game in the Week 6 recap.
Data: the model's prediction and the DraftKings total as shown on our
dashboard Thursday evening, October 8 (both update until kickoff), and
this season's games, lines and team stats through Week 5. History: every
game from 2017 to 2025 with a posted total, from CollegeFootballData.com;
the model backtest covers outdoor games only. Records against the total
leave out pushes. “Hot streak” numbers count only teams that
had played at least four games with a line that season. The full
analysis is in uga_bama_preview_2026.ipynb in the project; the Friday
update's test is section 4 of totals_model_tweaks.ipynb.