
How Kickers Got Good
In 1965, a college field goal try was worse than a coin flip: kickers made 46.8% of them. Last season they made 76.6%, the best in the 61 years of records we pieced together. A 50-yarder? In 1969 that went in about one time in nine. In 2025, about half of them did. So what happened? Better kickers, sure. But also a few rule changes that moved the numbers overnight, one that knocked kickers back for sixteen years, and one that everybody expected to matter and didn't.
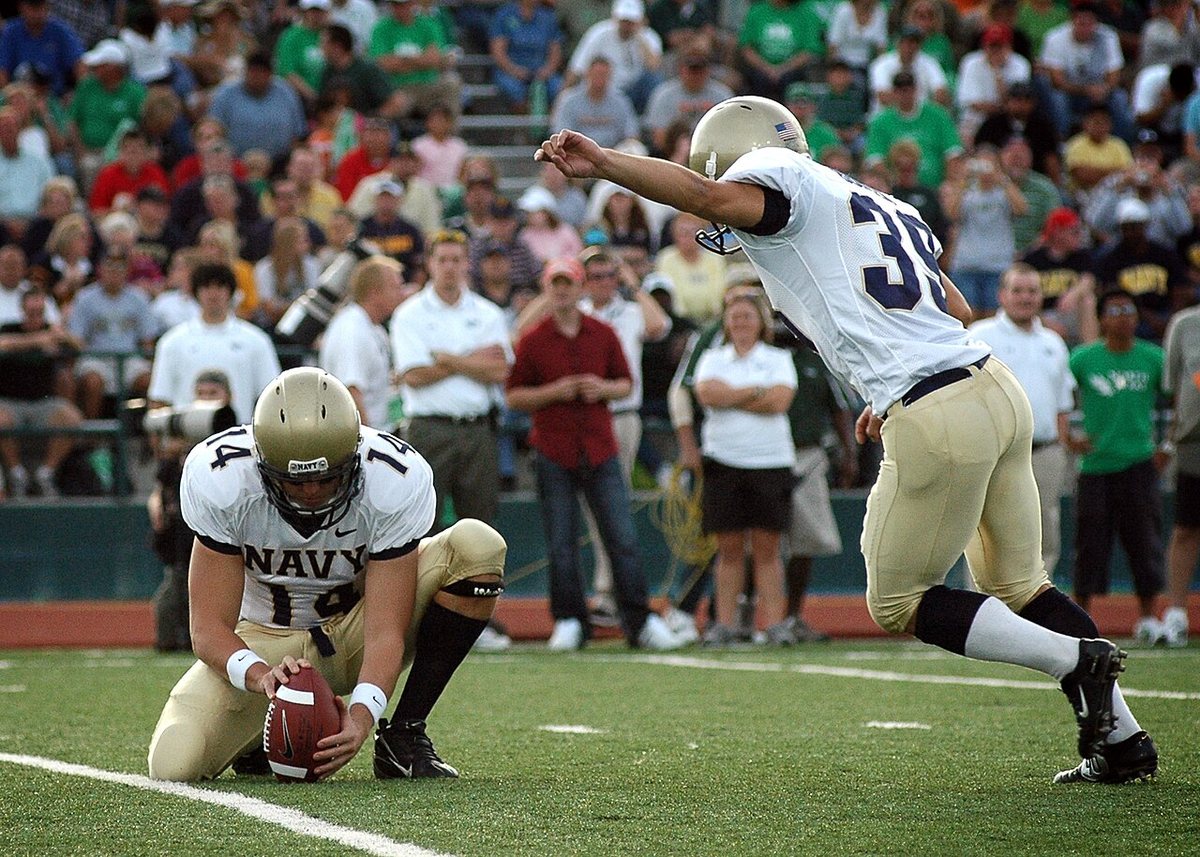

Sixty-one years in one line
The NCAA has kept a national field-goal tally since the 1930s, and its records book lists makes and tries for every season through 2021, split up by distance from 1969 on. For 2022 through 2025 we counted every field goal try in the play-by-play ourselves. Here's the whole thing:
NCAA records book through 2021; our count of every try in the play-by-play for 2022–2025. Hover a season for its number.
It's mostly a long, steady climb. But see those two cliffs? Neither one is about kickers suddenly getting better or worse. They're about the rules.
Cliff #1: the year long kicks got expensive (1978)
Before 1978, a missed field goal just turned into a touchback: the other team got the ball at its own 20. So why not try a 55-yarder? If it missed, you'd basically punted. Then the rule changed: a miss went back to where the kick was snapped from. Suddenly a missed long kick handed the other team great field position.
Coaches noticed immediately. Tries from 50 yards or longer dropped from 426 in 1977 to 131 in 1978, and the national make rate jumped from 49.2% to 58.2% in a single season. The kickers didn't change. The kicks did.
Better kickers, or easier kicks?
That 1978 jump raises a fair question about the whole climb. Maybe kickers didn't get better at all, and coaches just stopped asking them to do hard things?
Nope. Split the kicks up by distance, and every distance got better:
Same sources as above. Before 1979 the records book lumps everything from 50 yards on together, so “50+” means the same thing all the way across.
Same kicks, different kickers
To take the “easier kicks” part out completely, we gave every season the same menu of kicks: 2025's mix of short, medium and long tries. Then we asked how each season's kickers would have done on that menu, using how they actually kicked from each distance. The 1969 kickers come out at 46.0%. The 2025 kickers: 76.6%.
Kicks from under 40 yards went from 61.7% to 87.1%. From 40 to 49: 29.4% to 66.4%. And 50-plus, the scary ones: 11.1% to 50.7%. That's a different sport.
The rule that didn't matter (1989)
In 1989 the NCAA banned the kicking tee for field goals: from then on, the holder had to put the ball right on the ground. Kickers everywhere were supposed to suffer. Instead, the make rate went up, from 67.3% in 1988 to 69.2% in 1989.
Cliff #2: the posts got skinny (1991)
This one actually hurt. Back in 1959, college goal posts had been widened to 23 feet, 4 inches. In 1991 they were narrowed back to 18 feet, 6 inches, the same width the NFL uses. That's almost five feet less room.
The national make rate fell from 67.0% to 59.6% in one season. And it hit the short kicks hardest: from under 40 yards, kickers went from 79.9% to 68.1%. Short kicks used to be the gimme, and suddenly a third of them missed. It took until 2007 for kicks under 40 to get back to where they'd been in 1990. That's sixteen years of kickers growing up aiming at a skinnier target.
Two years later, in 1993, the hash marks moved in toward the middle of the field, which should make the angles easier. The overall rate barely moved: 64.9% to 64.5%.

Goodbye, toe ball
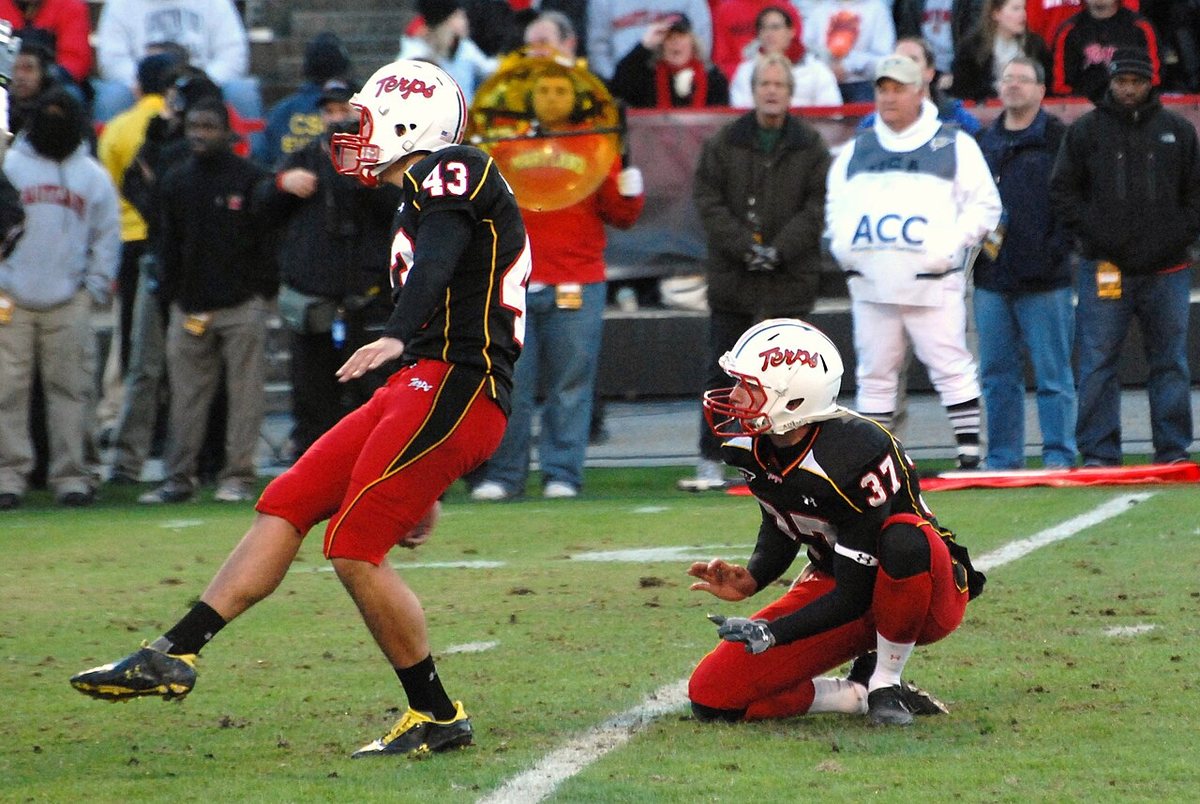
If you watch old game film, a lot of kickers run straight at the ball and kick it with the toe. Soccer-style kickers, who swing in from the side and hit it with the instep, gradually took over. The records book tracked the two groups separately for years, and the last season it lists any straight-on kickers at all is 1994.
One thing that didn't change much: how far made kicks go. The average made field goal was 34.1 yards in 1975 and 33.9 yards in 2019. Kickers got more accurate at every distance, but the typical kick that goes through is still a mid-30s yarder.
Kicks are a bigger part of scoring
In 1965 a team made 0.42 field goals a game, and kicks were 7.5% of its points. Field goals peaked at 1.21 a game in 2007. Their share of points peaked even earlier, at 15.6% in 1984, before offenses got so good at scoring touchdowns. These days it's about 12%.
Right now: the 50-yard boom
Here's the shorter-term trend, and it's a big one. From 2014 through 2017, FBS games had about 166 tries from 50 yards or longer a season, and 41.3% went in. From 2022 through 2025: about 289 a season, at 50.4%. In 2024 kickers made 54.8% of 367 long tries. Coaches are trusting their kickers from farther out than ever, and the kickers are earning it.
| Distance | 2014–17 | 2022–25 |
|---|---|---|
| Under 40 yards | 82.9% | 85.7% |
| 40–49 yards | 59.5% | 65.5% |
| 50+ yards | 41.3% | 50.4% |
Even the truly ridiculous ones are in play: from 2022 through 2025, kickers made 11 of 24 tries from 60 yards or longer.
And because we're a weather site: wind
We matched 19,623 field goal tries from 2018 through 2025 to the weather at kickoff (outdoor stadiums only) and compared kicks from the same distance. Wind matters, but less than you might think: a 40-yarder goes in 72.8% of the time in calm air and 68.1% in a 20 mph wind. Rain didn't show a clear effect, though we only had a few hundred rainy tries to go on.
One sneaky thing: in really windy games (15 mph or more), kicks from 50-plus went in 52.6% of the time, better than in calm air. That's almost certainly coaches being picky, only trying long ones with the wind at the kicker's back. Our weather data has wind speed but not direction, so we can't prove it. But it's a good reminder that coaches choose which kicks to try, and that shapes every number in this post.
Data: national field goal totals, tries by distance, average distances
and per-game scoring from the NCAA FBS Records Book (2022 edition),
1965–2021; every field goal try in games with an FBS team from
CollegeFootballData.com play-by-play, 2018–2025, used for
2022–2025. In the seasons both cover (2018–2021), the
play-by-play counts up to 5% more tries than the NCAA, but its overall
make rates land within about a point. Like the NCAA's, these counts include
tries by FCS teams against FBS teams. Kickoff weather from our own
database. The 1978 rule change is from the season's
Wikipedia page;
the 1959, 1989, 1991 and 1993 changes are from the notes in the
records book. The full analysis is in fg_history.ipynb in
the project.