
We Brought Back the BCS
From 1998 to 2013, a math formula decided who played for the national championship. Two polls, six computers, one crystal football and roughly a billion furious message-board posts. Then the playoff showed up and the BCS was sent off to retirement. Well, we dragged it back out. Starting this week, our Rankings page has BCS standings again, rebuilt from scratch. The big question: is our copy any good? So we ran it on the real thing.


How the BCS worked
The BCS (Bowl Championship Series) ranked teams with one number, the BCS average. The top two teams at the end of the regular season played for the title. From 2004 to 2013, that number was built from three equal parts:
The BCS average, in three pieces
Poll No. 1 (the Harris poll): a team's voting points as a share of the most it could get. If every voter puts you first, that's 1.0000.
Poll No. 2 (the Coaches Poll): the same idea.
The computers: six computer rankings. Each one gives a team 25 points for 1st, 24 for 2nd, all the way down to 1 point for 25th. Then the team's best and worst computer get thrown out, and the other four are added up and divided by 100.
Add the three pieces, divide by 3, and you've got the BCS average. Highest number wins.
Here's how it works for this week's No. 1, Georgia. The AP poll gives Georgia .9971 and the Coaches Poll .9903. The six computers rank Georgia 5th, 2nd, 4th, 1st, 4th and 1st. That's 21, 24, 22, 25, 22 and 25 points. Toss the best (a 25) and the worst (the 21), and the other four add up to 93, so the computer part is .93. Average the three: .9725.
One more rule that matters: from 2002 on, the computers weren't allowed to care about how much you won by. Only whether you won, who you beat and where. Beating somebody 70–0 counted exactly the same as beating them 7–6. Running up the score did nothing. (Running up the score is still rude.)
Rebuilding six computers
Here's the tricky part. The real BCS used six computer rankings run by six different people, and only one of them ever published every detail of how it worked. So we rebuilt each one from what its creator said about it:
| Computer | The idea, and how close our copy is |
|---|---|
| Colley | Every win and loss, adjusted for who it was against, solved all at onceOur copy: exact. Wes Colley published the method. |
| Wolfe | The ratings that make the season's results most likelyOur copy: close. Same kind of model, with home field. |
| Massey | A similar "most likely" model, with a little built-in cautionOur copy: close. Same kind of model. |
| Sagarin | Chess-style ratings: your opponents' average, plus how often you beat themOur copy: approximate. |
| Billingsley | Starts from last season and goes game by game, so when you win mattersOur copy: approximate. |
| Anderson & Hester | Your record, plus how good your opponents' records areOur copy: approximate. |
The polls needed a fix too. The Harris poll was created after the AP refused to let the BCS use its poll after the 2004 season, and the Harris poll retired along with the BCS. So in our version, the AP poll stands in for the Harris poll. Yes, the AP is back in the BCS, against its will. Sorry, AP.
Is our copy any good?
A rebuilt BCS is only fun if it acts like the real one. Luckily, the real BCS standings are still out there. Our data has 53 of them, from 2007 to 2013. So we ran our copy on every one of those weeks, using only the games and polls from that point in the season, and compared. We didn't tune anything to match: the settings were picked before we ever looked.
To see what each part adds, we also tried two half-versions: just the two polls, and just our six computers.
| Version | Avg. spots off | Exact spot | Top two right |
|---|---|---|---|
| Full copy | 0.75 | 50.64% | 92.45% |
| Polls only | 1.23 | 35.55% | 75.47% |
| Computers only | 2.38 | 18.72% | 45.28% |
What "average spots off" means
Take every team in a real BCS top 25 and ask: where did our copy put it? If the real BCS had a team 8th and we had it 9th, that's 1 spot off. Average that over all 53 weeks. Zero would be a perfect match.
So the full copy lands each real top-25 team within 0.75 spots on average. It gets the exact spot about half the time (50.64%) and is within one spot 84.60% of the time. Our six computers also earn their keep: polls alone miss by 1.23 spots and get the top two right only 75.47% of the time. (The computers on their own are pretty wild, which is also true of the real ones. That's why the BCS mixed them with the polls.)
The copy is sharpest where it matters most. For real No. 1 through 5, it's off by 0.19 spots on average and exactly right 83.02% of the time. Down at Nos. 21–25 it's off by 1.52. Part of that is our data: we only have each poll's top 25, so a team that was getting a few votes from 26th on down gets zero from us.
And the big one: who would have played for the title?
| Season | Real BCS No. 1 and 2 | Our copy |
|---|---|---|
| 2009 | Alabama, Texas | Alabama, Texas |
| 2010 | Auburn, Oregon | Auburn, Oregon |
| 2011 | LSU, Alabama | LSU, Alabama |
| 2012 | Notre Dame, Alabama | Notre Dame, Alabama |
| 2013 | Florida State, Auburn | Florida State, Auburn |
Five final standings, five matching title games. (For 2007 and 2008, our data stops one week before the final standings, so those two aren't in this table.)
The one that got away: Oklahoma vs. Texas, 2008
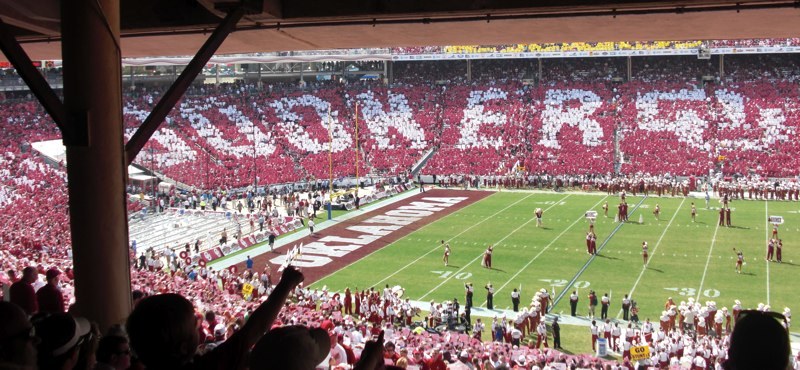

In 2008, the Big 12 South turned into rock, paper, scissors. Texas beat Oklahoma 45–35. Texas Tech beat Texas 39–33. Oklahoma beat Texas Tech 65–21. All three finished the regular season 11–1, and only one could go to the Big 12 title game. After every normal tiebreaker failed, the Big 12's rule said: whoever's highest in the BCS standings goes. On Nov. 30, 2008, the BCS had Oklahoma at .9351 and Texas at .9223, according to the 2008 Big 12 season's history. Oklahoma went, crushed Missouri 62–21 for the conference title, and then lost the national title game to Florida, 24–14. Texas fans have been calm and normal about all of this ever since. (They have not.)
Our copy picks Texas instead: .9236 to Oklahoma's .9181, a gap of .0055. Most of that, .0033, comes from our computers. Three of our six rebuilt computers put Texas first, which makes sense for computers that only look at who beat whom: Texas beat Oklahoma. The real computers saw it the other way, and with five of our six being approximations, that's exactly the kind of close call where a copy can slip. So, Texas fans: our robot agrees with you. It does not have a vote.
The 2026 standings
The real BCS released its first standings in mid-October, so ours start now too. This week's top five:
| Team | BCS average | |
|---|---|---|
| 1 | Georgia | .9725 |
| 2 | Notre Dame | .9391 |
| 3 | Miami | .9111 |
| 4 | Indiana | .8359 |
| 5 | Alabama | .7960 |
The fun part is where the polls and the computers argue. Computers don't care about your helmet or your preseason hype, just your results. Among the 25 teams in this week's standings:
- Ohio State: 5th by the polls, 15th by the computers. The voters still believe. The computers want to see more.
- James Madison: 25th by the polls, 9th by the computers. Somebody tell the voters.
- UCLA: 12th by the polls, 4th by the computers.
- Ole Miss: 10th by the polls, 20th by the computers.
You'll find the full list on the Rankings page under Polls, as “BCS standings (replica).” Hover over any team to see its three pieces and where each computer has it. It updates every week after the new polls come out.
What's not quite right
- Five of the six computers are our best guess. We followed what each creator described, not their actual code.
- The AP poll isn't the Harris poll. They usually agree, but not always.
- Only the top 25 of each poll count. The real BCS gave points for every vote, so we're a little blurrier at the bottom of the list.
Next up: the College Football Playoff committee releases its first rankings in early November, and we're working on predicting what the committee will say before it says it. The BCS at least showed its math. The committee… less so.
Data: game results, AP Top 25, Coaches Poll and BCS standings from
CollegeFootballData.com (53 BCS standings releases, 2007–2013;
CFBD's 2011 week-14 release is an exact copy of that season's final
standings, so we left it out). The formula and the computers are in
bcs_formula.py; the check against the real standings is
bcs_replica.ipynb in the project. BCS history:
Bowl Championship Series,
2008 Big 12 season,
Colley Matrix method.