
Fluke or For Real?
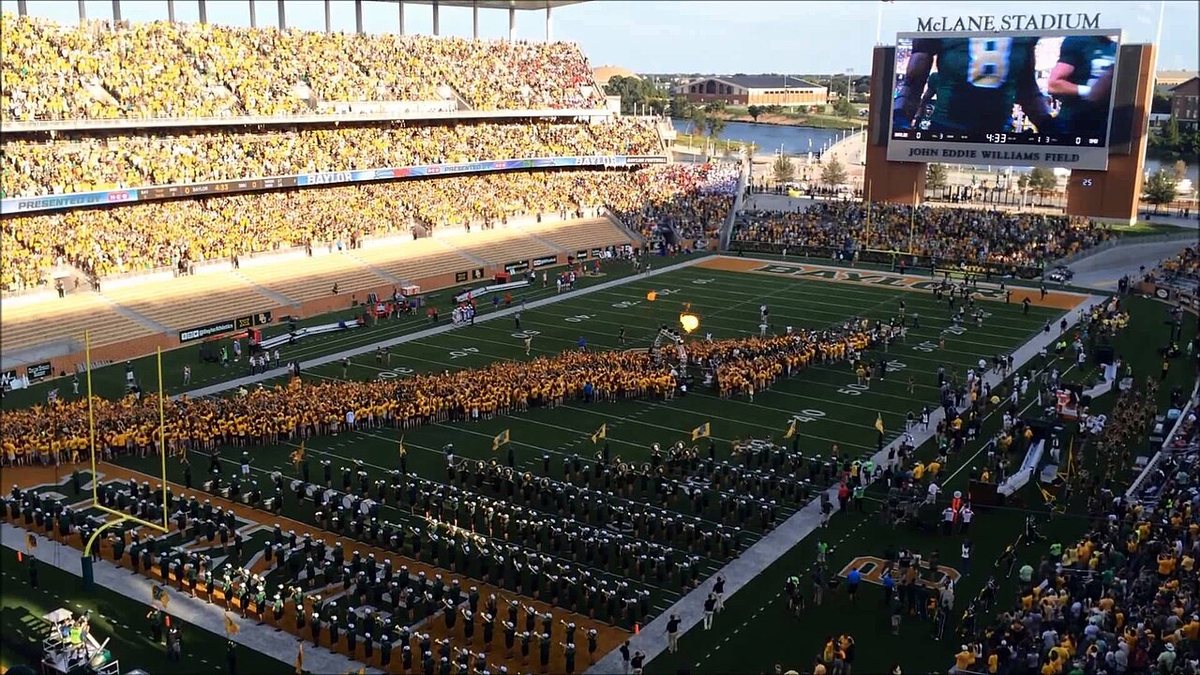
Saturday night, Baylor flew to Tempe as a 3.5-point underdog. Arizona State was supposed to win a close one. Instead, Baylor won 55–19. That's not “beating the spread.” That's beating it by 39.5 points, picking it up, and throwing it into the Arizona desert. So two questions: where does a night like that rank in Baylor history? And does a blowout like this actually tell you anything about the rest of the season, or is it just one weird game? (Full disclosure: the person who runs this site bleeds green and gold. The numbers don't care.)

First: what was supposed to happen?
“Better than expected” needs an expected. We used three ways to measure it, and each one sees a different stretch of history.
Three ways to say what should have happened
The point spread is the betting market's guess at the final margin. Baylor +3.5 means people expected Baylor to lose by about 3 or 4. Our lines go back to 2013.
Elo is a rating that goes up when you win and down when you lose, more when the result is a surprise. It's the same idea chess uses to rank players. Every 23.3 Elo points is worth about a point on the scoreboard. It goes all the way back to 1965, and it only knows about games already played.
SP+ is a rating built from how well each team actually played, not just who won. The catch: we have each season's final SP+, so it already knows how the season turned out. For 2026, that's SP+ after five weeks, including this game.
Subtract what was expected from what happened and you get “points over expectation.” Before kickoff, Elo had Baylor losing by 3.1, a 42% chance to win. The spread had Baylor losing by 3.5. Here's how a 36-point win stacks up against every Baylor win each measure can see:
| Measured against | Points over expected | Rank among Baylor wins |
|---|---|---|
| The spread (2013–2026) | +39.5 | 2nd of 98 |
| Elo (1965–2026) | +39.1 | 10th of 307 |
| SP+ (1970–2026) | +34.0 | 6th of 287 |
The only win that beat the spread by more: November 30, 2019, at Kansas. Baylor was a 14-point favorite and won 61–6, beating the line by 41. And among Baylor's wins over Big 12 teams since 2018, only two had a bigger raw margin: that Kansas game (55 points) and a 45–7 win at Kansas in 2021 (38). Poor Kansas. Both of those came as the favorite, though. Tempe came as the underdog.
Points better than Elo's pregame expectation, from Baylor's side. Hover a bar for Baylor's pregame chance to win. Elo is the one measure that covers every season, so it gets the chart.
The top of the list is wild: a 55–0 win at Army in 1979, a 55–7 win over Kansas in 2010 (Kansas again!), and a 50–7 win at Texas in 1989. The 2013 team shows up twice. When you score 70 points four times in one season, the expectations stop keeping up.
How rare is a game like this nationally? Of 40,115 FBS wins over FBS teams since 1965, 1.9% beat Elo by at least 39.1 points. In a typical recent season, that's about 15 games out of hundreds. Not once-in-a-lifetime, but definitely a night you remember.
Okay, but does it mean anything?
Here's the fun question. When a team blows the doors off a game it was supposed to lose, there are two stories you could tell:
- For real: this team is better than everyone thought, and the game just revealed it.
- Fluke: the ball bounced their way, the other team had a bad night, and next week everything goes back to normal.
To find out, we looked at every FBS team-game from 1965 to 2025 and asked: how did that team play for the rest of the season? The trick is what we compare against. We “froze” each team's Elo rating where it was before the big game. If the blowout was pure luck, the team should go right back to playing like that old rating. If it was real, the team should keep beating it.
Every FBS team-game against an FBS opponent, 1965–2025, grouped by how far it beat (or missed) Elo's expectation. Each dot is the average for the rest of that team's season, in points per game. Hover a dot for the number of games behind it.
Look at the orange line first. It slopes up, so the surprise is partly real. But it's a gentle slope. Teams that won by 30 or more points over expectation (2,491 of them, averaging 36.8 over) played 4.6 points per game better than their old rating for the rest of the season. That's 12.6% of the surprise, about 1 in 8. The other 7/8 was bounces, matchups and one-night magic. It works the other way too: teams that got blown out by 30+ more than expected played about 5.4 points per game worse afterward.
Why only 1 in 8?
One game is a tiny sample. Even when Elo's guess is good, real results land, on average, about 16.3 points away from it in one direction or the other. Turnovers, a busted coverage, a kick return, a backup quarterback. So most of any one big surprise is noise, and only a slice is the team actually being better. Statisticians call the rest “regression to the mean”: extreme results drift back toward normal.
Now the blue line. That's the rest of the season compared to Elo after it updates for the big game. It sits right around zero. In other words, Elo already bumps a team up by about the right amount. Those big winners won 57.5% of their remaining games. Their old ratings said 48.1%; their updated ratings said 58.0%. Nailed it.
The betting market catches on too. Teams that beat the spread by 30+ in a win covered 1,651 of their next 3,306 spreads, 49.9%, basically a coin flip, same as everybody else (50.0%). So no, a blowout isn't a secret signal to go bet on a team next week. (Betting is for adults anyway, and the house usually wins.)
Two more things we checked:
- Timing matters a little. Early in the season, ratings still lean on last year, so a big early surprise carries more: 14.6% when it came in a team's first four games against FBS teams, 10.8% after that. Tempe was Baylor's fourth.
- How you win didn't matter much. CFBD's postgame win probability (from 2010 on) says how likely the win was based on how each team actually moved the ball. You'd expect lucky blowouts to carry over less than dominant ones, but there's no clear pattern: blowouts with a postgame win probability under 90% kept 4.9 points per game, 90–99% kept 3.3, and 99%+ kept 5.2.
Baylor's own track record
Nationally, it's 1 in 8. Baylor, though, has a history of big blowouts that turned into big seasons. Here's every Baylor season with a win of 30+ points over Elo's expectation with games still left to play (the first one each season):
| Season | The big win | Over Elo | Before | After (vs. FBS) | Wins expected after (old rating) | Final | Final AP |
|---|---|---|---|---|---|---|---|
| 1965 | 31–0 at Texas A&M | +31.9 | 2–2 | 2–3 | 2.4 | 5–5 | — |
| 1972 | 27–0 at Missouri | +35.4 | 0–1 | 4–5 | 2.4 | 5–6 | — |
| 1974 | 31–14 vs. Oklahoma State | +32.7 | 0–2 | 7–2 | 2.7 | 8–4 | 14 |
| 1978 | 24–6 at Texas A&M | +32.6 | 0–5 | 2–3 | 2.7 | 3–8 | — |
| 1979 | 55–0 at Army | +51.3 | 4–2 | 3–2 | 2.2 | 8–4 | 14 |
| 1980 | 42–7 at Lamar | +32.1 | 0–0 | 9–2 | 6.0 | 10–2 | 14 |
| 1988 | 35–0 at Iowa State | +30.6 | 2–0 | 2–5 | 3.3 | 6–5 | — |
| 1989 | 49–3 at SMU | +39.7 | 2–3 | 2–3 | 2.2 | 5–6 | — |
| 2010 | 55–7 vs. Kansas | +48.3 | 3–1 | 3–5 | 2.2 | 7–6 | — |
| 2011 | 45–38 vs. Oklahoma | +30.8 | 6–3 | 3–0 | 1.4 | 10–3 | 13 |
| 2012 | 52–24 vs. Kansas State | +40.1 | 4–5 | 3–0 | 1.2 | 8–5 | — |
| 2013 | 70–13 vs. Buffalo | +34.9 | 1–0 | 9–2 | 6.3 | 11–2 | 13 |
| 2014 | 48–14 at Oklahoma | +36.6 | 7–1 | 3–1 | 3.0 | 11–2 | 7 |
| 2015 | 70–17 vs. Rice | +31.5 | 2–0 | 7–3 | 6.8 | 10–3 | 13 |
| 2019 | 63–14 vs. UTSA | +34.2 | 1–0 | 9–3 | 3.8 | 11–3 | 13 |
| 2024 | 59–35 at Texas Tech | +36.0 | 2–4 | 5–1 | 2.5 | 8–5 | — |
Add it up: after those 16 big wins, Baylor went 73–40 the rest of the way. The old ratings expected about 51 wins. Even the updated ratings only expected 65. And 8 of those 16 teams finished in the final AP poll. Baylor has only 11 ranked finishes in the 61 seasons from 1965 to 2025, so most of them came in a year with one of these games.
Before anyone prints championship T-shirts: 16 seasons is a small sample, and some of these teams were just underrated going in. The 2013 and 2019 blowouts came in their very first game against an FBS team, before Elo had seen anything. And there are duds too. In 2010, Baylor smashed Kansas 55–7 to go 4–1, then went 3–5 against FBS teams the rest of the way. The 1988 team won 35–0 at Iowa State and went 2–5 against FBS teams after.
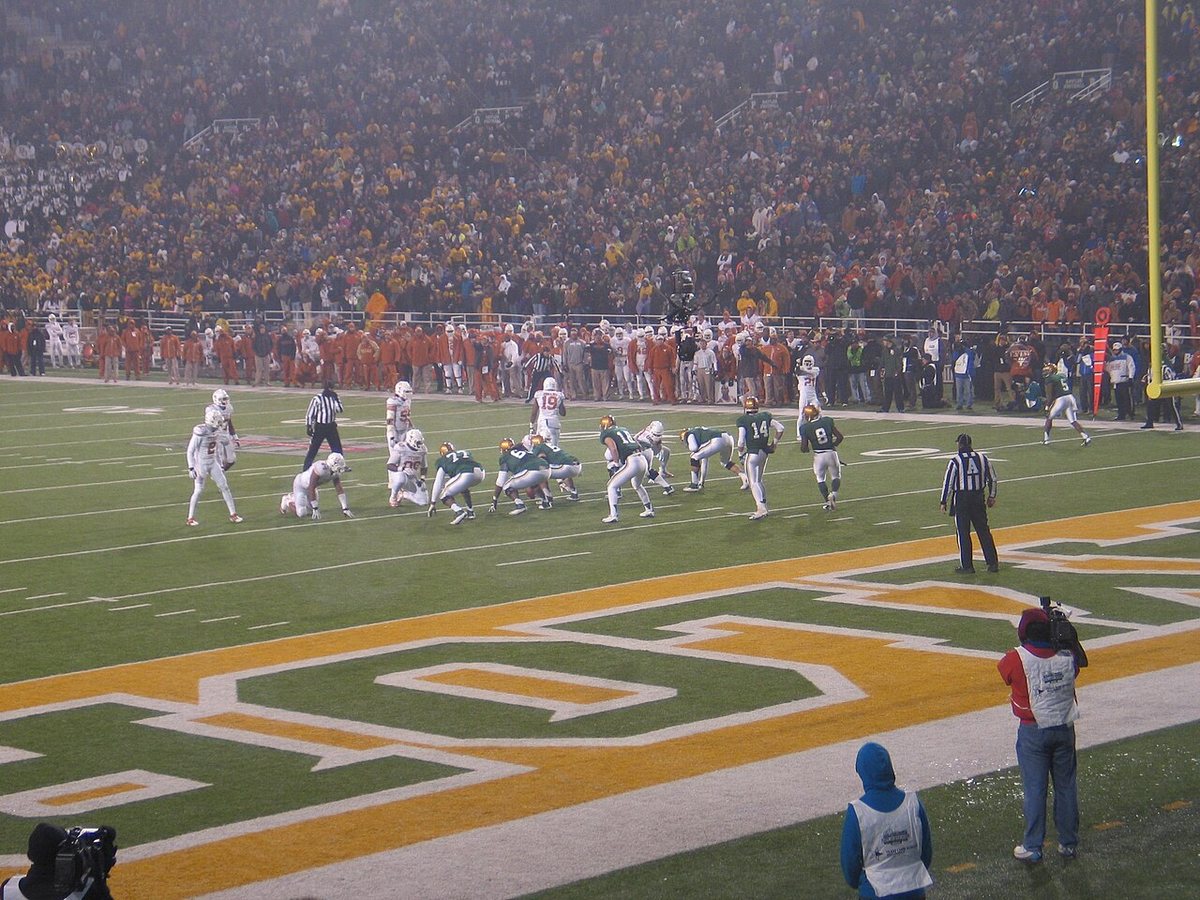
The closest match to right now might be 2024. Baylor was 2–4, went to Lubbock and won 59–35, then went 5–1 the rest of the way.

So what about 2026?
First, was Tempe a lucky night? Partly. Here's the box score:
| Baylor | Arizona State | |
|---|---|---|
| Points | 55 | 19 |
| Total yards | 564 | 409 |
| Yards per carry | 6.8 | 3.3 |
| Yards per pass | 7.4 | 7.0 |
| Third downs | 9 of 15 | 4 of 15 |
| Turnovers | 0 | 3 |
| Success rate | 42.6% | 40.7% |
“Success rate”
The share of plays that gain “enough”: half the yards needed on first down, 70% on second down, all of them on third or fourth. It's a measure of steady, chain-moving football. (Garbage time is left out.)
Baylor ran the ball all over Arizona State and won the turnover battle 3–0. But play for play, the two offenses were almost equally successful. Baylor's edge came from big plays and takeaways, which are exactly the things that don't usually repeat. CFBD's postgame win probability still gave Baylor 98.5%, so Baylor deserved the win. The 36-point margin is the part to take with a grain of salt.
So how much should Baylor fans adjust? History says about 1/8 of 39.1 points, or 4.9 points per game (5.7 if you use the early-season number). Elo already moved Baylor from 1537 to 1648, worth 4.8 points per game. That's right in line with history. Here's what that does to the rest of the schedule:
| Week | Opponent | Baylor's chance before Tempe | Now |
|---|---|---|---|
| 7 | TCU | 52% | 63% |
| 8 | at Kansas | 33% | 44% |
| 9 | at UCF | 47% | 59% |
| 10 | Iowa State | 45% | 56% |
| 11 | at BYU | 26% | 37% |
| 12 | Texas Tech | 23% | 33% |
| 13 | at Houston | 41% | 53% |
| Expected wins | 2.7 | 3.4 |
At 4–1 with 3.4 more expected wins, Baylor projects to finish the regular season around 7–5, with four games now leaning Baylor's way instead of one. Texas Tech and BYU are still uphill. And if this team turns out to be one of those Baylor teams that blows past its ratings, like 2013, 2019 or 2024? Well, there's precedent.
The bottom line: Tempe was real, but only partly. Roughly 1/8 of it is a better team; the rest was a great night. Enjoy it either way. Nights like that only happen about 15 times a season.
Data: game results, pregame Elo ratings (1965–2026), postgame win
probability (2010 on), SP+ ratings (1970–2026), point spreads
(2013–2026) and the Arizona State box score from
CollegeFootballData.com. Spreads are from real sportsbooks from 2017;
for 2013–16 they're CFBD's consensus line. Elo is converted to
points with one slope fit on every FBS-vs-FBS game since 1965, plus a
home-field edge for each season (2026, only five weeks old, uses the
2016–25 average). “Rest of season” covers later
games against FBS teams, bowls included. Final AP rankings were only a
top 20 before 1989. The full analysis is in
baylor_surprise_wins.ipynb in the project.